Download
1 / 25
250 likes | 252 Views
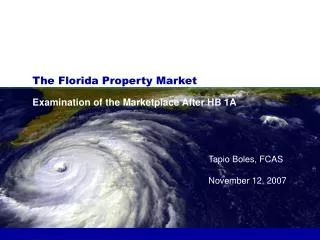
Explore the latest data and market trends in the Danish property market. Get insights on dwelling stock, rental market, economic vacancy rates, construction, investment properties, and more.

E N D
The Danish Property Market The Danish Property Federation
Building Stock Source: The Danish Property Federation Market Statistics Note: June 2019
Property Investment Market Source: The Danish Property Federation Market Statistics Note: August 2019
Dwelling Stock dividedinto Types of Ownership Source: The Danish Property Federation Market Statistics Note: 2008 and January 2019
Type of rent in PRS Source: The Danish Property Federation Market Statistics Note: May 2019
Levels of market rent in Denmark Source: The Danish Property Federation Market Statistics Note: April 2019
EconomicVacancy for Office Source: The Danish Property Federation Market Statistics, IPD Danish Property Index and Oline-ED Statistics Note: January 1988 to June 2019 Data break betweenOctober 2013 and January 2014 due to differences in methodology 7
EconomicVacancy Rates Source: The Danish Property Federation Market Statistics, IPD Danish Property Index and Ejendomstorvet -ED Statistics Note: January 2000 to June 2019 Data break betweenOctober 2013 and January 2014 due to differences in methodology 8
Dwellingswithout Person Registration Source: Statistics Denmark Note: 1981 to 2019
Started Construction Source: 1949-2016: Statistics Denmark2017-2020: Dansk Byggeri Note: 1949 to 2020
Residential construction by builders Source: Statistics Denmark Note: 1949 to 2019
Residential construction by type Source: Statistics Denmark Note: 1949 to 2019
Investment Property sold Source: Statistics Denmark Note: 1949 to 2019
Investment Property sold Source: Statistics Denmark Note: 1949 to 2018
Investment Property Prices Source: Statistics Denmark Note: January 1992 to December 2018 The indices arebased on nominal square meter prices
Real Price Index for Detached Houses Source: 1971-1995: Danmarks Nationalbank and Statistics Denmark 1995-2018: The Association of Danish Mortgage Banks Note: 1971 to 2018
Net Lending by Mortgage Banks Source: The Association of Danish Mortgage Banks Note: January 1995 to February 2019
Rent and Residential Property Prices Relative to the Wage Rate Development Source: The Association of Danish Mortgage Banks and Statistics Denmark Note: January 1995 to December 2018 Therewas a change in the make up of the rent indexbetween 2015Q3 and 2015Q4
Rent Level and Vacancy for Offices in Copenhagen Source: Ejendomsforeningen Danmark og Sadolin & Albæk from July 2015. Data from Oline-ED Statistics and Sadolin & Albæk beforeJuly 2015. Note: January 1997 to January 2018. New source from July 2015 for vacancy rate.
Prime Office Rents in Europe Source: Knight Frank Research og Real Capital Analytics Note: 2014
Real Total Return Source: The Danish Property Federation, IPD Danish Property Index and Sadolin & Albæk Note: 1985 to 2017
The Danish Property FederationMarket Statistics – ConsensusForecast Total return for investment properties. 2011 to 2018 shows the total return form the Danish Property Federation’s market statistics, while it from 2000 to 2010 shows the total return of MSCI Denmark Annual Property Index. 2019 to 2021 shows the average of the replies from the Consensus Forecast. 50 percent of the replies lie within the blue lines. www.ejd.dk/EDMF Source: The Danish Property Federation Market Statistics and MSCI Note: April 2019
ReimbursementDuty Rate in Danish Municipalities Source: Statistics Denmark Note: 2019
Municipalitieswhere the Rent Control Actapplies Source: The Landsowners´ Investment Foundation Note: 2019 Dark blue is regulated
info@ejd.dk www.ejd.dk Phone number: +45 33 12 03 30 The Danish Property Federation Nørre Voldgade 2 DK-1358 København K Havnegade 4DK-8000 Aarhus C