Download

1 / 10
110 likes | 134 Views
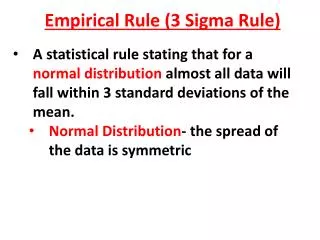
Using the Empirical Rule. Normal Distributions. These are special density curves. They have the same overall shape Symmetric Single-Peaked Bell-Shaped They are completely described by giving its mean ( ) and its standard deviation ( ) . We abbreviate it N( ,). Normal Curves….

E N D
Normal Distributions • These are special density curves. • They have the same overall shape • Symmetric • Single-Peaked • Bell-Shaped • They are completely described by giving its mean () and its standard deviation (). • We abbreviate it N(,)
Normal Curves…. • Changing the mean without changing the standard deviation simply moves the curve horizontally. • The Standard deviation controls the spread of a Normal Curve.
Standard Deviation • It’s the natural measure of spread for Normal distributions. • It can be located by eye on a Normal curve. • It’s the point at which the curve changes from concave down to concave up.
Why is the Normal Curve Important? • They are good descriptions for some real data such as • Test scores like SAT, IQ • Repeated careful measurements of the same quantity • Characteristics of biological populations (height) • They are good approximations to the results of many kinds of chance outcomes • They are used in many statistical inference procedures.
Empirical Rule • What percent do you think…… • www.whfreeman.com/tps4e
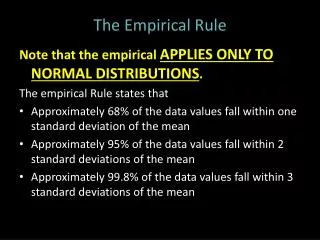
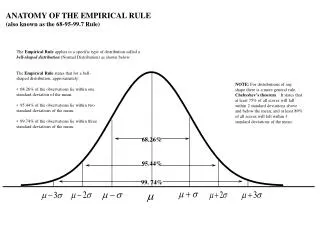
Empirical Rule (68-95-99.7 Rule) • In the Normal distribution with mean () and standard deviation (): • Within 1 of ≈ 68% of the observations • Within 2 of ≈ 95% of the observations • Within 3 of ≈ 99.7% of the observations
The distribution of batting average (proportion of hits) for the 432 Major League Baseball players with at least 100 plate appearances in the 2009 season is normally distributed defined N(0.261, 0.034). • Sketch a Normal density curve for this distribution of batting averages. Label the points that are 1, 2, and 3 standard deviations from the mean. • What percent of the batting averages are above 0.329? • What percent are between 0.227 and .295?
Scores on the Wechsler adult Intelligence Scale (a standard IQ test) for the 20 to 34 age group are approximately Normally distributed. N(110, 25). • What percent are between 85 and 135? • What percent are below 185? • What percent are below 60?
Homework • Page 131 (43-46)