Download
1 / 31
310 likes | 434 Views
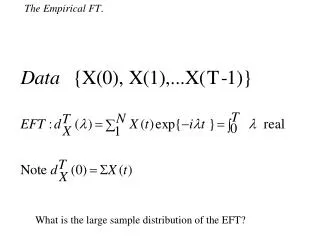
The Empirical FT. What is the large sample distribution of the EFT?. The complex normal. Theorem. Suppose p.p. N is stationary mixing, then. Proof. Write. Evaluate first and second-order cumulants Bound higher cumulants Normal is determined by its moments. Consider.

E N D
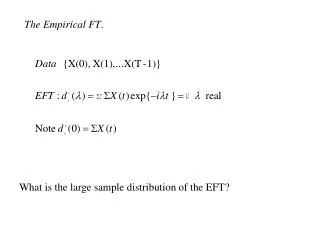
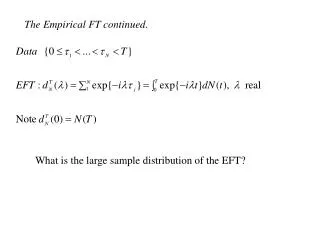
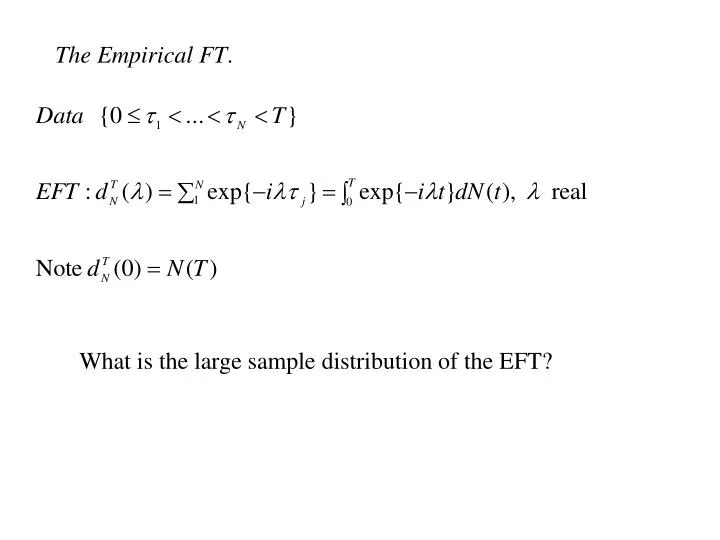
The Empirical FT. What is the large sample distribution of the EFT?
Proof. Write Evaluate first and second-order cumulants Bound higher cumulants Normal is determined by its moments
Comments. Already used to study rate estimate Tapering makes Get asymp independence for different frequencies The frequencies 2r/T are special, e.g. T(2r/T)=0, r 0 Also get asymp independence if consider separate stretches p-vector version involves p by p spectral density matrix fNN( )
Estimation of the (power) spectrum. An estimate whose limit is a random variable
Some moments. The estimate is asymptotically unbiased Final term drops out if = 2r/T 0 Best to correct for mean, work with
Periodogram values are asymptotically independent since dT values are - independent exponentials Use to form estimates
Indirect estimate Could approximate p.p. by 0-1 time series and use t.s. estimate choice of cells?
Estimation of finite dimensional . approximate likelihood (assuming IT values independent exponentials)
Crossperiodogram. Smoothed periodogram.
Large sample distributions. var log|AT| [|R|-2 -1]/L var argAT [|R|-2 -1]/L
Networks. partial spectra - trivariate (M,N,O) Remove linear time invariant effect of M from N and O and examine coherency of residuals,
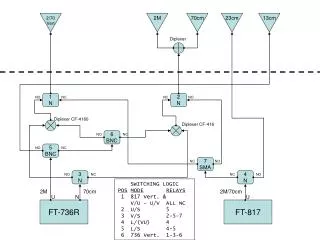
Point process system. An operation carrying a point process, M, into another, N N = S[M] S = {input,mapping, output} Pr{dN(t)=1|M} = { + a(t-u)dM(u)}dt System identification: determining the charcteristics of a system from inputs and corresponding outputs {M(t),N(t);0 t<T} Like regression vs. bivariate
Realizable case. a(u) = 0 u<0 A() is of special form e.g. N(t) = M(t-) arg A( ) = -
Advantages of frequency domain approach. techniques formany stationary processes look the same approximate i.i.d sample values assessing models (character of departure) time varying variant ...
Fig. 2. DCS restores locomotion and desynchronizes corticostriatal activity R. Fuentes et al., Science 323, 1578 -1582 (2009) Published by AAAS