Download
1 / 19
190 likes | 308 Views
Interactions of hadrons in the SiW ECAL Towards paper. Naomi van der Kolk. Aim. CALICE Analysis Note CAN-025: Study the interactions of π - in the SiW ECAL at low energies (2 – 10 GeV ) and compare various Monte Carlo Models (physics lists) to this data

E N D
Interactions of hadrons in the SiW ECALTowards paper Naomi van derKolk
Aim CALICE Analysis Note CAN-025: Study the interactions of π- in the SiW ECAL at low energies (2 – 10 GeV) and compare various Monte Carlo Models (physics lists) to this data Check and revise the analysis presented in the Analysis Note on the FNAL 2008 SiW ECAL testbeam data and prepare the publication
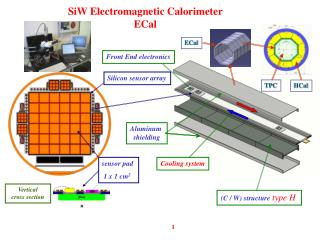
Analysis setup • Event sample: • SiW ECAL physics prototype • 2008 FNAL testbeam of π- at 2, 4, 6, 8 and 10 GeV • Matching Monte Carlo (physics lists: FTFP_BERT, QGSP_BERT, LHEP, CHIPS, FTF_BIC, QGSP_BIC, QGS_BIC) • Event cuts: • correct trigger, minimum number of hits (25), hits in correct region of Ecal (centre), minimum hit energy (0.6 mip), no noisy layers, muon rejection, multiple particle event rejection, electron rejection • Sample size: • 500 k MC events (accepted 25 k – 300 k) • 150 k – 700 k data events (accepted 20 k – 450 k)
Event Classification • Classify events as interacting or non-interacting • The absolute and relative energy increase in subsequent layers defines the interaction point • In the note each category was again subdivided, but these criteria depended strongly on event cuts and will not be applied for the paper • We will refine the event classification with machine learning techniques (more independent criteria) in future
Interaction Layer Add ECAL picture Monte Carlo π- events (QGSP_BERT) Other physics lists have a very similar distribution Missed interaction (interaction present in MC but not found) Incorrect interaction (interaction found but not present in MC)
Interaction finding Efficiency Depends on MC physics list, especially at low energy, Bertini/Fritiof based models have the lowest efficiency Efficiency = fraction of all true interacting events that is classified as interacting Contamination = fraction of all events classified as interacting that is non-interacting Between 0.03 at 2 GeV and 0.05 at 10 GeV
Interaction Fraction The interaction fraction is rather constant with beam energy The error on the data is based on the spread in MC interaction finding efficiency
High energy fraction in single layers 2 GeV At 2 GeV for 21% of events more than 60% of the energy is deposited in a single layer! At 10 GeV this is only 3% Similar observation reported by TohruTakeshitaat the last CALICE collaboration week at Desy.
Longitudinal Energy Profile for events classified as interacting 2 GeV 4 GeV 6 GeV The data is not well described by the MC. Fritiof based models fit best. For non-interacting events the profile is approximately flat. 8 GeV 10 GeV
Mean Shower Radius for events classified as interacting 2 GeV 4 GeV 6 GeV Clear difference between data and MC especially at low energy. Fritiof/Bertini models have a similar peak position, others models have on average a smaller shower radius. 8 GeV 10 GeV
Summary • Interacting events can be identified with an efficiency above 65%. • These are compared to MC physics lists. • Fritiof and Bertini based models seem to describe the data best. • Next: • Finalize the paper by evaluating the error contributions • Since October collaboration between LAL and LLR ILC groups and LAL AppStat group to better characterise and understand hadronic showers using machine learning techniques. First step: finding the most discriminating features (characteristics) of the shower and testing different machine learning techniques. • B. Kegl, F.Dubard, V. Boudry, M. Ruan, T.H. Tran, R. Poeschl, N. van derKolk Special thanks to T. Frisson and D. Benbouzid
Selection criteria for event types • Interacting • FireBall (inelastic hadronic interaction) • Absolute energy increase Ei > Ecut && Ei+1>Ecut && Ei+2>Ecut • Relative energy increase F=(Ei+Ei+1)/(Ei-1+Ei-2)>Fcut && F’ = (Ei+1+Ei+2)/(Ei-1+Ei-2)> Fcut && Earoundi>0.5Ei • Peaked • Local relative energy increase F>Fcut && F’ > Fcut not valid anymore at layer i+3 • Non-interacting • Scattered (elastic scattering) • Lateral distance of two pixels or more between the incoming and outgoing track • Mip • All events which do not fit the other criteria
Rejection efficiency for events with multiple incoming particles • A muon may coincide with a pion • Reject such events from the analysis by rejecting events with two large clusters of hits in the first 8 layers that have a small slope. • Simulate “double events” -> Overlay pion events with muon events (add the hit collections together) • Eff = #rejected/#total MC physics list FTFP_BERT
Estimate the contamination of “double events” in the accepted event sample in data Upper limit: Assume all rejected events were real double eventscontamination = (1-effd)/effd*rejected Estimate: rejected events are the sum of double and single eventscontamination = (1-effd)*(rejected – effs*total)/(effd - effs)
Step 1: SelectAndConvert hitType == Sim “ProtoSD03Collection” hitType == Digi “EmcCalorimeter_Hits” hitType == Reco “EmcCalorimeter_Hits” Set triggers true Set triggers true Check the triggers bits from the event header. Does the event pass the energy dependent trigger condition? Calculate the energy weighted average hit position (c.o.g) Calculate the energy weighted average hit position (c.o.g), exluding isolated hits C.o.g. in the correct region? Check for noisy hits, pads and layers. Accept events without noisy layers. Number of hits > 25 ? Reject events with two MC particles where only one reaches the ECAL. Add hits to the output collection which are not isolated and deposit a minimum amount of energy Check for the number of hits in HCAL and TCMC to reject muons Add the output collection “ECALConvCalorimeterHits” to the event
Step 2: MipFinder2 Input collection “ConvCalorimeterHits” Select the most likely candidate cluster (with more that 3 hits) based on the slope of a fit to the cluster hits Assign each hit to its layer object Find the first layer with a hit Reject the event if there are two large clusters with a slope less than 0.7 Start clustering in the first layer up to the 8th layer. If hits are closer than a minimum distance they are added to that cluster. Else they seed a new cluster Add the cluster with the smallest slope to the output cluster collection “EcalClusters” Merge clusters if they are close enough together
Step 3: InteractionFinder Input hit collection “ConvCalorimeterHits” Input cluster “EcalIncomingClusters” Calculate the mean position and stdev Make a fit to the cluster hits and calculate the extrapolated track position for all layers Calculate the deposited energy per layer, excluding hits that are more than 3.5 stdev from the mean position Calculate the energy deposited around the extrapolated track Find the interaction layer based on increasing absolute energy The last 3 layers are excluded Find the interaction layer based on relative increasing energy The first 2 and last 3 layers are excluded Save event type in the hit collection Find scattered events
Step 4: CaliceEcalHitInfo Input hit collection “ECALConvCalorimeterHits” Input cluster “EcalIncomingClusters” Fill histograms and a TTree of event and hit properties For MC calculate efficiency and contamination