Download
1 / 46
550 likes | 1.14k Views
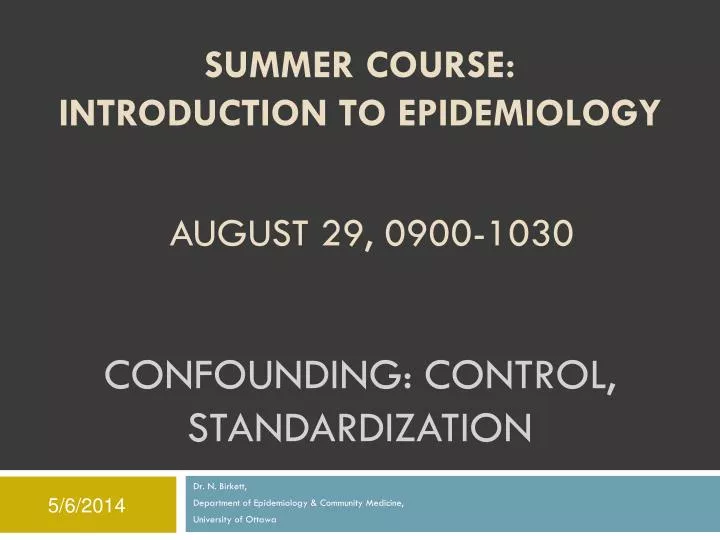
Summer Course: Introduction to Epidemiology. August 29, 0900-1030. Confounding: control, standardization. Dr. N. Birkett, Department of Epidemiology & Community Medicine, University of Ottawa. Session Overview. Review methods used to control, prevent or deal with confounding

E N D
Summer Course:Introduction to Epidemiology August 29, 0900-1030 Confounding: control, standardization Dr. N. Birkett, Department of Epidemiology & Community Medicine, University of Ottawa
Session Overview • Review methods used to control, prevent or deal with confounding • Review matching methods • Present standardization methods both direct and indirect (SMR). • This session will give you a ‘flavour’ of the more advanced things in our graduate courses
Confounding (1) Consider a case-control study relating alcohol intake to mouth cancer risk. • Crude OR = 3.2 (95% CI: 2.1 to 4.9) • Stratify the data by smoking status (ever/never): • Ever: OR = 1.2 (95% CI: 0.5 to 2.9) • Never: OR = 1.2 (95% CI: 0.5 to 2.9) • Best guestimate of the ‘true’ OR is 1.2 • This is a simple type of Adjusted OR • More complex methods are used in the ‘real world’. • This is CONFOUNDING.
Confounding (2) Alcohol Mouth cancer Smoking Alcohol Mouth cancer ???
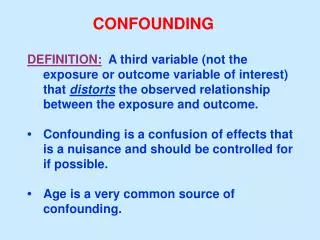
Confounding (3) • Confounding requires three or more variables. • Two variables with multiple levels cannot produce confounding. • Three requirements for confounding • Confounder relates to outcome • Confounder relates to exposure • Confounder is not part of causal pathway between exposure and outcome
Confounding (4) • Confounding is a very serious problem in epidemiological research • Potential confounders are often unknown • Odds Ratio for leukemia in children living near high power hydro lines is about 1.3 • BUT, could be explained by unknown confounders • e.g. pesticide application to grass under hydro towers.
Confounding (5) • How do we deal with confounding? • Prevention • You need to ‘break’ one of the links between the confounder and the exposure or outcome • ‘Treatment’ (analysis) • Stratified analysis • Like my simple example • Standardization • We’ll discuss this later • Regression modeling methods • Covered in a different course
Confounding (6) • Prevention • Randomization • One of the big advantages of an RCT • Restriction • Limits the subject to one level of confounder • Study effect of alcohol on mouth cancer ONLY in non-smokers • Matching • Ensures that the distribution of the exposure is the same for all levels of confounder
Confounding (7) • Randomization • The ‘treatment’ is the exposure in the confounding triangle. • Subjects randomly assigned to each treatment without regard to other factors. • On average, distribution of other factors will be the same in each treatment group • Implies no confounder/exposure correlation • no confounding. • Issues • Small sample sizes • Chance imbalances • Infeasible in many situations • Stratified allocation
Confounding (8) • Restriction • Limit the study to people who have the same level of a potential confounder. • Study alcohol and mouth cancer only in non-smokers. • Lack of variability in confounder means it can not ‘confound’ • There is only one 2X2 table in the stratified analysis • Relatively cheap
Confounding (9) • Restriction (cont.) • ISSUES • Limits generalizability • Cannot study effect of confounder on risk • Limited value with multiple potential confounders • Continuous variables? • Can only study risk in one level of confounder • exposure X confounder interactions can’t be studied • Impact on sample size and feasibility • Alternative: do a regular study with stratified analysis • Report separate analyses in each stratum
Confounding (10) • Matching • The process of making a study group and a comparison group comparable with respect to some extraneous factor. • Breaks the confounder/exposure link • Most often used in case-control studies. • Usually can’t match on more than 3-4 factors in one study • With 4 factors, minimum # of matching groups: • 2x2x2x2 = 16 • Let’s talk more about matching
Matching (1) • Example study (case-control) • Identify 200 cases of mouth cancer from a local hospital. • As each new case is found, do a preliminary interview to determine their smoking status. • Identify a non-case who has the same smoking status as the case • If there are 150 cases who smoke, there will also be 150 controls who smoke.
Matching (2) Here is the confounder/outcome 2x2 table in the observed study: Implies no smoking/outcome link and no confounding
Matching (3) Two main types of matching • Individual (pair) • Matches subjects as individuals • Twins • Right/left eye • Frequency • Ensures that the distribution of the matching variable in cases and controls is similar but does not match individual people.
Matching (4) • Matching by itself does not fully eliminate confounding in a case-control study! • You must use analytic methods as well • Matched OR • Stratified analyses • Logistic regression models • In a cohort study, matching is uncommon • But, if done, no need to use complex statistics to complete adjustment
Matching (5) • Advantages • Strengthens statistical analysis, especially when the number of cases is small. • Increases study credibility for ‘naive’ readers. • Useful when confounder is a complex, nominal variable (e.g. occupation). • Without matching, standard statistical methods can be problematic, especially if many levels have very few subjects.
Matching (6) • Disadvantages • You can not study the relationship of matched variable to outcome. • Can be costly and time consuming to find matches, especially if you have many matching factors. • Often, some important predictors can not be matched since you have no information on their level in potential controls before doing interview/lab tests • Genotype • Depression/stress • If matching factor is not a confounder, can reduce precision and power.
Matching (7) Individual matching • My personal view • many studies misrepresent frequency matching as individual matching • In many apparent cases of individual matching, that isn’t what is going on. • Most useful when there is a strong ‘natural’ pairing. • Twins • Body parts • Analysis uses McNemar method to estimate OR (and to do a chi-square test). • Unit of analysis is the pair.
Matching (8) 625 pairs of subjects • 201 pairs where both case and control were exposed • 80 pairs where only case was exposed • 43 pairs where only control was exposed • 302 pairs where neither case or control were exposed
Matching (9) • If exposure causes disease, there should be more pairs with only the case exposed then pairs with only the control exposed. • McNemar OR = 80/43 = 1.86 • Ignoring matching would give OR=1.28
Matching (10) • Can calculate a statistical test of the null hypothesis that OR=1.0 (McNemar’s chi-square test)
Matching (11) • McNemar OR = b/c • ‘a’and ‘d’pairs contribute no information on OR (wasteful of interviews). • Avoiding this justifies ‘counter-matching’, another advanced topic • Make sure table is set-up correctly!! • More sophisticated analysis uses conditional logistic regression modeling (another course).
Matching (12) Frequency matching • Most commonly used method • Many ways to implement this. Here is one: • Case-control study of prostate cancer. • Cases will include all new cases in Ottawa in one year. • Based on cancer registry data, we know what the age distribution of cases will be. • Controls selected at random from the population. • We use the projected distribution of age in the cases to describe how many controls we need in each age group.
Matching (13) • 400 cases & 400 conts • 5% of cases are under age 60 • I want 5% of my controls to be under 60 • 400 * 0.05 = 20 • Similarly for other age groups
Matching (14) • Frequency matching (cont.) • Do you distribute the control recruitment through-out the case recruitment period? • Analysis must stratify by matching groups or strata • Having too many matching groups is a problem • How do I find the matching controls? • Only 4% of the population is between age 75 & 84 but about 30% of my cases are in this group. How do I efficiently over-sample this age group? • Lack of control selection lists in Canada • Random Digit Dialing (RDD) methods. • Volunteers
Confounding (11) Analysis options • Stratified analysis • Divide study into strata based on levels of potential confounding variable(s). • Do analysis within each strata to give strata-specific OR or RR. • If the strata-specific values are ‘close’, produce an adjusted estimate as some type of average of the strata-specific values. • Many methods of adjustment are available. • Mantel-Haenzel is most commonly used.
Confounding (12) • Stratified analysis (cont.) • Strata specific OR’s are: 2.3, 2.6, 3.4 • Strata-specific sample sizes: 100, 200, 50 • A ‘credible’ adjusted estimate should be between 2.3 and 3.4. • Simple average is: 2.8 • Ignores the number of subjects in the strata. If one group has very few subjects, its estimate is less ‘valuable’. • Weight by # of subjects in each group: • Mantel-Haenzel does the same thing with different weights
Confounding (13) • Stratified analysis (cont.) • This approach limits the number of variables which can be controlled or adjusted. • Also hard to apply it to continuous confounders • But, gives information about strata-specific effects and can help identify effect modification. • Used to be very common. Now, no longer widely used in research with case-control studies. • Stratified analysis methods can be applied to cohort studies with person-time. This is still commonly used
Confounding (14) • Analysis options • Regression modeling • Beyond the scope of this course • The most common approach to confounding • Can control multiple factors (often 10-20 or more) • Can control for continuous variables • Logistic regression is most popular method for case-control studies • Cox models (proportional hazard models) are often used in cohort studies.
Standardization (1) • Crude prostate cancer incidence rates (fictional): • Canada (2000): 100/100,000 • Canada (1940): 50/100,000 • Does this mean that prostate cancer is twice as common in 2000 (RR = 2.0)? • Yes, the rate is twice as high • BUT: answer is too simplistic if it is taken to mean that people in 2000 are at higher risk of developing prostate cancer.
Standardization (2) • Concern is that the population in Canada is older in 2000 than in 1950. • Prostate cancer incidence increases with age. • Sound familiar? Age Calendar time Prostate cancer
Standardization (3) • Changes in the age distribution of the Canadian population could confound any change in incidence over time. • Will make it appear that the population is at higher risk when it really isn’t • This is really a type of confounding. • For historical reasons, this issue is usually taught as a separate topic, often before confounding is introduced. • Approached through direct standardization or age adjustment.
Standardization (4) • Remember stratified analysis? • Divide the sample into strata • Within each stratum, compute the OR/RR/etc. • Produce an average of the strata-specific estimates to adjust for the confounder. • Roughly, the same process is used for direct standardization.
Standardization (5) Direct Standardization • Compute age-specific incidence in each study group. • Select a reference population (can be anything) • Multiply the age-specific incidence by the # of people in the reference population in that age stratum ‘expected’ number of cases • Add up the ‘expected’ number and divide by the total size of the reference population. Age-adjusted rate for the study group. • Let’slook at an example
Standardization (6) RRA:B= 2.35 Mean age: Area A = 63.4 yrs. Area B = 49.7 yrs.
Standardization (7) RR in each age stratum (A vs. B) = 0.75 not 2.35
Standardization (8) • Why the difference? • Area ‘B’ is a lot younger than area ‘A’. • Incidence increases with age. • confounding by age. • Direct standardization • First, select reference population • Use combined population of area ‘A’ and area ‘B’.
Standardization (10) Area A adjusted incidence = 1,110/32,000 = 0.0347 Area B adjusted incidence = 1,480/32,000 = 0.0463 The adjusted RR (area A to B) = 0.75
Standardization (11) • Adjustment has rendered the rates comparable by eliminating the confounding due to age. • There are more complex ways of doing this but this approach gives the basic ideas.
Standardization (11) NO!! • Does it always work? • If the rate is higher in one area for younger age groups but lower for older ones, adjustment can give a misleading picture. • Do NOT treat adjusted rates as ‘real’ rates. • To estimate the burden of illness, you must use unadjusted rates. • What if the group has very few events? • SMR & indirect standardization.
Standardization (12) Indirect Standardization • Used when the study group has few cases so the age-specific rates will be unstable (subject to wide chance variation). • Does not produce adjusted estimates. • Is used to compare study population to rates expected based on a large general population or reference population. • Rate taken from reference pop (unlike direct standardization). • Main statistic produced is the SMR (standardized mortality rate)
Standardization (14) Indirect Standardization (cont.) • SMR does not depend on the number of observed events in each age stratum. • Only the total # of observed events matters. • That is why it is useful when the number of cases is small. • Interpret an SMR similar to an RR or OR: < 1.0 protection 1.0 null value (no effect) > 1.0 increased risk
Summary • Confounding is a very common problem • Try to prevent it through: • Restriction • Matching • Use statistical methods to adjust for it: • Stratified analysis • Matched analysis • Regression modeling