Download
1 / 60
600 likes | 696 Views
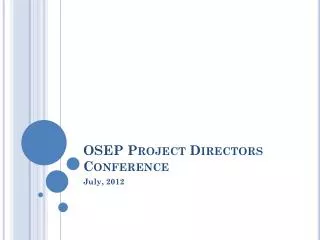
OSEP Project Directors. Alexa Posny, Ph.D. Assistant Secretary Office of Special Education and Rehabilitative Services U.S. Department of Education July 23, 2012. “No Place Like School…”.

E N D
OSEP Project Directors Alexa Posny, Ph.D. Assistant Secretary Office of Special Education and Rehabilitative Services U.S. Department of Education July 23, 2012
“We will not be able to keep the American promise of equal opportunity if we fail to provide a world-class education to every child.” —President Barack ObamaMarch 2010 Education For a More Competitive America & Better Future
Our Objective… • All students will acquire the same essential knowledge and skills • All students learning will be carefully monitored, and will be given multiple opportunities to demonstrate their learning • All students will promptly receive extra time and support if they experience difficulty in learning • All students teachers will clarify the standards they will use in assessing the quality of student work • All students will be the beneficiaries of educators who have promised to work together collaboratively to use the practices that have a positive impact on their achievement
Are You Smarter Than A 5th Grader? • Seven months of the year have 31 days; how many have 28? • 1 • 3 • 9 • 1 2
Are You Smarter Than A 5th Grader? • Seven months of the year have 31 days; how many have 28? • 1 • 3 • 9 • 1 2
Are You Smarter Than A 5th Grader? Which group of United States Presidents is in the correct chronological order? Jefferson, Lincoln, Grant ,Roosevelt Washington, Adams, Pierce, Jackson Jackson, Madison, Truman, Wilson Polk, Lincoln, Hayes, Grant
Are You Smarter Than A 5th Grader? Which group of United States Presidents is in the correct chronological order? Jefferson, Lincoln, Grant ,Roosevelt Washington, Adams, Pierce, Jackson Jackson, Madison, Truman, Wilson Polk, Lincoln, Hayes, Grant
Are You Smarter Than A 5th Grader? • The Smith family has a Mother, Father and 7 daughters. Each daughter has 1 brother. How many people are in the family? • 9 • 10 • 15 • 16
Are You Smarter Than A 5th Grader? • The Smith family has a Mother, Father and 7 daughters. Each daughter has 1 brother. How many people are in the family? • 9 • 10 • 15 • 16
Are You Smarter Than A 5th Grader? • You are driving along in your car on a wild, stormy night. You pass by a bus stop, and you see three people waiting for the bus. • An old lady who looks as if she is about to die. • An old friend who once saved your life • The perfect man (or) woman you have been dreaming about. • Which one would you choose to offer a ride to knowing that there could only be one passenger in your car?
Are You Smarter Than A 5th Grader? Give the car keys to the old friend and let him take the old lady to the hospital. You stay behind and wait for the bus with the man/woman of your dreams.
Are You Smarter Than the Assistant Secretary? • Which country has the highest college graduation rate? • Canada • Korea • Germany • Japan
Are You Smarter Than the Assistant Secretary? • Which country has the highest college graduation rate? • Canada • Korea • Germany • Japan
President Obama’s Goal “…by the end of the decade, (we) will have the highest proportion of college graduates in the world…We simply cannot achieve that goal without Americans of all ages and abilities going to college and getting degrees in far greater numbers than they are today. ” Arne Duncan, Secretary US Education Department
2020 Goal: Game Changers • Early childhood service delivery systems aligned and providers qualified • Teacher training programs designed to prepare all teachers to teach students with disabilities • All students with disabilities provided personalized learning and needed interventions • All assessments accessible by students with disabilities resulting in accurate information about what they know and can do • Transition services supporting students with disabilities’ post-secondary completion and employment
OUR VISION: All ED offices owning the “game changers”OUR MISSION: All ED offices engaged in implementing actions to “change the game”
Are You Smarter Than the Assistant Secretary? • From 1991 to today, how many more infants, toddlers and preschoolers receive services under IDEA? • 44,000 • 104,000 • 148,000 • 194,000
Are You Smarter Than the Assistant Secretary? • From 1991 to today, how many more infants, toddlers and preschoolers receive services under IDEA? • 44,000 • 104,000 • 148,000 • 194,000
Game Changer #1 Early childhood service delivery systems are aligned and providers are qualified
Early Intervention Works High quality early learning programs result in: • Significant improvement in early literacy, language and math skills • A 50% decrease in the rate of special education placements through 2nd grade • A 33% decrease in grade repetition through 8th grade • A 32% lower incidence of juvenile arrests Source: IDEA data – Part C Child Count 2010 Table 8-1 https://www.ideadata.org/arc_toc12.asp#partcCC; Rosenberg, Zhang, & Robinson. (2008). Prevalence of Developmental Delays and participation in Early Intervention Services for Young Children.
Alignment and Provider data • Many states do not have a comprehensive and coordinated early childhood system. • Multiple early childhood programs administered by different agencies exist. • Each agency uses different policies, procedures, and funding streams. • There are multiple systems of personnel preparation and/or licensing across the country in early childhood special education. • Early Intervention (EI) credentialing requirements differ across all states. • Methods used by states who offer an EI credential are inconsistent. • The EI credentialing process is complex and idiosyncratic across states. Sources: The Center to Inform Personnel Preparation Policy and Practice in Early Intervention and Preschool Education. (2008). Study IV: National Status of Early Intervention Personnel Credentials Think Tank: May 24-25, 2006 in Washington, D.C. (2007). Study V:Analysis of State Licensure/Certification Requirements for Early Childhood Special Educators Think Tank: June 11-12, 2007 in Washington, D.C.
Game Changer #1: Early childhood services Objective: Improve services for infants, toddlers and preschoolers with disabilities in natural environments and inclusive settings to enhance their development and to prepare them to enter kindergarten ready to learn.
Are You Smarter Than the Assistant Secretary? • Currently, what percentage of teachers in the United States are special education teachers? • 3 • 10 • 14 • 27
Are You Smarter Than the Assistant Secretary? • Currently, what percentage of teachers in the United States are special education teachers? • 3 • 10 • 14 • 27
Game Changer #2 Teacher training programs are designed to prepare all teachers to teach students with disabilities
All Teachers Teach Students with Disabilities Sources: U.S. Department of Education -NCES, Common Core of Data, ELsI Table Generator, Accessed May 31, 2011. -OSEP, 618 Data Collection: Personnel, ideadata.org, Accessed May 31, 2011.
What We Need • By 2020, over 440,000 teachers will retire • 55% of new teachers leave within the first five years • 55% of new teachers in DC leave within the first two years
IMPROVING PREPARATION FOR TEACHERS • Recent research on first-year general education teachers indicates that: • 17% did not receive preparation for working with SWDs. • Of those who did, 52% classified the preparation as “a little” or “not at all” useful. • Recent research on first-year special education teachers indicates that: • 80% felt prepared to work with SWDs.
Game Changer #2: Teacher training programs Objective: Prepare and retain great teachers, leaders, and service providers to meet the needs of children, youth and adults with disabilities and improve their outcomes.
Are You Smarter Than the Assistant Secretary? • Today, almost 60% of students with disabilities spend approximately 80 percent or more of their time in general education each day. What was the percentage in 1989? • 6% • 16% • 32% • 43%
Are You Smarter Than the Assistant Secretary? • Today, almost 60% of students with disabilities spend approximately 80 percent or more of their time in general education each day. What was the percentage in 1989? • 6% • 16% • 32% • 43%
Game Changer #3 All students with disabilities have access to personalized learning and needed interventions
Least Restrictive Environments:Learning in Inclusive, Integrated Settings Source: U.S. Department of Education, Office of Special Education Programs, Data Analysis System (DANS), OMB #1820-0517: "Part B, Individuals with Disabilities Education Act, Implementation of FAPE Requirements," 2010. Table 2-2 , Sailor, W. (18 April 2002). Testimony submitted to President’s Commission on Excellence in Special Education Research Agenda Task Force.
Personalized Learning Works • Personalized learning emphasizes tailoring instruction to meet each student’s individual needs (including the use of accommodations and assistive technology) (Tomlinson, 2000, 2001) • Research has demonstrated that children with disabilities can achieve at high levels when provided appropriate supports and instruction • Previously low achieving students with disabilities who struggled in reading and math had significant increases in test scores (Allor et al., 2010; Fuchs et al., 2008; Gersten et al., 2009; Kampset al., 2008; Mautoneet al., 2009; Scammaccaet al., 2007; Vaughn, Denton, & Fletcher, 2010; Wanzek & Vaughn, 2010) Sources: Gersten, R., Beckmann, S., Clarke, B., Foegen, A., Marsh, L., Star, J. R., & Witzel, B. (2009). Assisting students struggling with mathematics: Response to Intervention (RtI) for elementary and middle schools(NCEE 2009-4060). Wanzek, J. & Vaughn, S. (2010). Tier 3 interventions for students with significant reading problems. Theory Into Practice, 49, 305-314; Tomlinson, C. A. (2000). Differentiation of Instruction in the Elementary Grades; Tomlinson, C. A. (2001). How to differentiate instruction in mixed-ability classrooms.
What we need Response to Intervention (RTI)… is a way of screeningchildren, early in their schooling, that can help schools and educators identifythose who may not be responding to instruction – and thus may be at risk for school failure. The technique allows schools, on a school-widebasis, to provide any student more intensive support–and monitor their progress—than may be typically available in every classroom.
Game Changer #3:Personalized Learning and interventions Objective: Ensure that children and youth with disabilities, including those with the most significant cognitive disabilities, have access to effective individualized instruction.
Are You Smarter Than the Assistant Secretary? • In what country did standardized assessments originate ? • Finland • United States • China • Britain
Are You Smarter Than the Assistant Secretary? • In what country did standardized assessments originate ? • Finland • United States • China • Britain
Game Changer #4 All assessments are accessible by students with disabilities and provide accurate information about what they know and can do
How are SWDs participating in Statewide Assessments? Source: United States Department of Education, Office of Special Education Programs, Individuals with Disabilities Education Act Data Accountability Center, 2008-2010.
Accountability:Holding All Students to High Standards • SWDs can meet college- and career-ready standards: • SWDs can excel within the general curriculum. • SWDs can be prepared for success in post-secondary including college and/or careers. • SWDs must be ensured: • Access to the general curriculum • Ability to meet their unique needs • IEPs with goals aligned to grade-level academic standards • Teachers and support personnel able to deliver high-quality, evidence-based, individualized instructional and support services. Sources: Gersten, R., Beckmann, S., Clarke, B., Foegen, A., Marsh, L., Star, J. R., & Witzel, B. (2009). Assisting students struggling with mathematics: Response to Intervention (RtI) for elementary and middle schools(NCEE 2009-4060). Wanzek, J. & Vaughn, S. (2010). Tier 3 interventions for students with significant reading problems. Theory Into Practice, 49, 305-314. Common Core State Standards Initiative. Application to Students with Disabilities. http://www.corestandards.org
Game Changer #4:Accessible assessments Objective: Improve achievement of students with disabilities as measured against college- and career-ready standards, and close the achievement gap between students with disabilities and peers.
Are You Smarter Than the Assistant Secretary? • Based on the current NLTS study, what percentage of youth with disabilities are enrolled in postsecondary education programs? • 20% • 40% • 60% • 80%
Are You Smarter Than the Assistant Secretary? • Based on the current NLTS study, what percentage of youth with disabilities are enrolled in postsecondary education programs? • 20% • 40% • 60% • 80%
Game Changer #5 Transition services better support students with disabilities’ post-secondary completion and employment
ACHIEVEMENT…AND ACHIEVEMENT GAPS:EMPLOYMENT OUTCOMES Source: U.S. Bureau of Labor Statistics, Table A-6, Last Modified: 10/7/2011