Download
1 / 27
270 likes | 403 Views
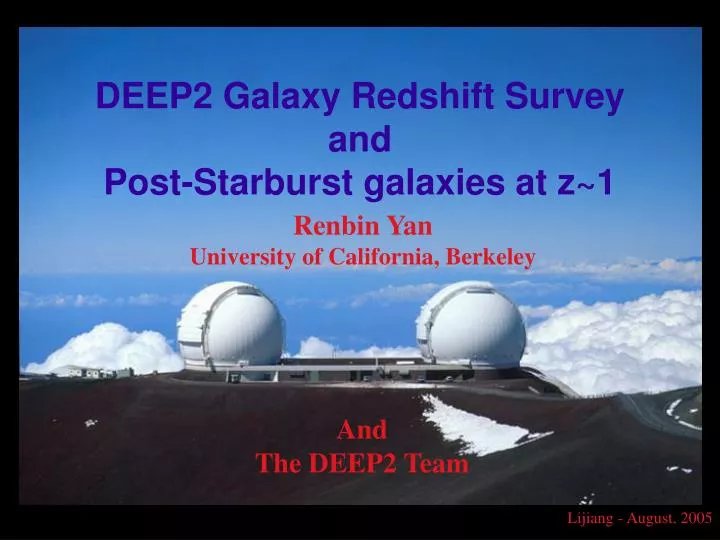
DEEP2 Galaxy Redshift Survey and Post-Starburst galaxies at z~1. Renbin Yan University of California, Berkeley. And The DEEP2 Team.

E N D
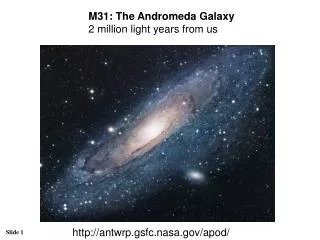
DEEP2 Galaxy Redshift SurveyandPost-Starburst galaxies at z~1 Renbin Yan University of California, Berkeley And The DEEP2 Team
The DEEP2 Galaxy Redshift Survey, which uses the DEIMOS spectrograph on the Keck II telescope, is studying both galaxy properties and large-scale structure at z=1. The DEEP2 Collaboration U.C. Santa Cruz S. Faber (Co-PI) D. Koo P. Guhathakurta D. Phillips C. Willmer B. Weiner R. Schiavon K. Noeske A. Metevier L. Lin N. Konidaris G. Graves JPL P. Eisenhardt Princeton D. Finkbeiner U. Pitt. A. Connolly K survey (Caltech) K. Bundy C. Conselice R. Ellis U.C. Berkeley M. Davis (PI) A. Coil M. Cooper B. Gerke R. Yan C. Conroy LBNL J. Newman U. Hawaii N. Kaiser
Comparison with Other Surveys DEEP2 was designed to have comparable size and density to previous generation local redshift surveys and is >50 times larger than previous surveys at z~0.3-1. DEEP2 is similar to LCRS in sample size but at z=1 - with a very different geometry: ~20801000 h-3 Mpc3 per field (LCDM) SDSS 2dF LCRS DEEP2 CFA+ SSRS z~0 z~1 PSCZ
A Redshift Survey at z=1: • Observational details: • 3 sq. degrees • 4 fields (0.5o x <2o) • primary z~0.75-1.4 (pre-selected using BRI photometry) • >40,000 redshifts • ~5·106 h-3Mpc3 • 80 Keck nights • One-hour exposures • RAB=24.1 • 1200 l/mm: ~6500-9200 Å • 1.0” slit: FWHM 68 km/s • Studying Evolution: • Age of the Universe = 13.7 Gyr • z=0.7 - ~6.0 Gyr ago • z=1.0 - ~7.5 Gyr ago • z=1.4 - ~8.5 Gyr ago • Within DEEP2 we are surveying • 2.5 Gyr or ~20% of the history • of the Universe, and SDSS/2dF comparisons give ~3x this baseline
DEEP2/CFHT B,R,I GALEX NUV+FUV Chandra & XMM: Past coverage Awarded (1.4Ms) Coordinated observations ofthe Extended Groth Strip (EGS) Spitzer MIPS, IRAC Background: 2 x 2 deg from POSS DEEP2 spectra and Caltech / JPL Ks imaging HST/ACS V,I (Cycle 13) Plus VLA (6 & 21 cm), SCUBA, etc….
Redshift Distribution of Data: z~0.7-1.4 Our color cuts are very successful! ~90% of our targets are at z>0.75 and we miss only 3% of high-z objects. • Status: • Designed as a • three-year survey • Began summer 2002 • 80 night UC time allocation is now complete • Finished 3 of 4 fields, 4th • >75% done (will complete • in S06)
Redshift Maps in 4 Fields: z=0.7-1.2 Cone diagram of 1/12 of the full DEEP2 sample
DEEP2 sees the same color bi-modality as SDSS, COMBO-17, etc. to z~1.4 Our R-band magnitude limit corresponds to ~4000Å rest-frame at z=0.7, ~2800 Å at z=1.4 . As redshift increases, red galaxies of a given luminosity fall out before blue ones. Willmeret al. 2005
Post-Starburst Galaxies (E+A or K+A) Post-starburst galaxies show little on-going star-formation (lack of emission lines) but strong Balmer absorption features due to recent star-formation (within 1 Gyr) - ‘post-starburst galaxies’. Their spectra can be well modeled by the combination of two components: an old stellar population and an A-star population.
Post-starburst Mysteries • Do all red sequence galaxies come from post-starbursts? • What is the abundance at high-z; Cluster vs. field? • What is their origin? Merger remnant? Satellite harassment? Superwind? Ram-Pressure Stripping? DEEP2 covers a large enough volume to find a large statistical sample. EGS will add multiwavelength SEDs and morphologies. We will be able to shed light on these issues.
The Selection of E+A galaxies We use H instead of [OII] because [OII] in red galaxies is heavily contaminated by AGN or LINERs. (Yan et al. in prep, see poster)
Color of Post-Starburst Galaxies These galaxies populate the ‘gap’ in the color bi-modality and part of the red sequence - they may provide clues as to how galaxies move onto the red sequence. We are investigating their morphologies and environments.
Other recent and upcoming papers include: • Angular clustering of galaxies : Coil et al., 2004, ApJ, 617, 765 • DEEP2 survey strategy & dark energy: Davis et al.,astro-ph/0408344 • Evolution of close-pairs/merger rates: Lin et al., 2004, ApJ, 617, 9 • Satellite galaxy kinematics: Conroy et al., astro-ph/0409305 • Measuring environment in deep redshift surveys: Cooper et al., submitted • Luminosity function: Willmer et al. & Faber et al., submitted. • Group correlation function: Coil et al., submitted. • Void statistics in the DEEP2 sample: Conroy et al., submitted. • Overview of the DEEP2 sample: Faber et al., in prep. First semester’s data is now public: http://deep.berkeley.edu/DR1
Poster: AGN Origin of [O II] in Red Galaxies---Implications for post-starburst galaxy studies Conclusions 1) Galaxies display bimodality in [O II]/Hα ratios, which corresponds to the bimodality in rest-frame colors. 2) Line-emitting red galaxies have line ratios following those of AGN or LINERs. 3) Post-starburst galaxies identified in the SDSS dataset using Hα often exhibit significant [O II] EW; their position in [O II]-Hα plot suggest they might be AGN or LINERs. 4) [O II] emission in LINERs can be as strong as in star-forming galaxies. Locally, it is only a proxy for SFR in blue galaxies. 5) post-starburst samples defined using [O II] will be very incomplete, especially if AGN rates and intensity were higher in the past. We recommend using H as an alternative for high redshift.
Pre-selection of high-z targets with using colors • Plotted are the colors of some galaxies with known redshifts in our fields; those at low redshift are plotted as blue, those at high redshift as red. We use a simple color cut defined by three line segments to select galaxies at z>0.75. • We do not apply these color cuts in the EGS!
DEEP2 slitmask spectroscopy l position Using custom-milled slitmasks with DEIMOS we are obtaining spectra of ~150 targets at a time. A total of 400 slitmasks will be required for the survey; we can tilt slits up to 30 degrees to obtain rotation curves.
Surveys of distant galaxies can constrain both cosmology and galaxy evolution • The evolution of large-scale structure is strongly dependent on the underlying cosmology. • By comparing the universe at high redshift to what is seen by large local surveys such as SDSS, one can perform many unique cosmological tests and simultaneously study galaxy formation and evolution.
Scientific Goals of the DEEP2 Galaxy Redshift Survey • Characterize the properties of galaxies (colors, sizes, linewidths, luminosities, etc.) at z~1 for comparison to z~0 • Study the clustering statistics (2- and 3-pt. correlations) of galaxies as a function of their properties, illuminating the nature of the galaxy bias • Determine N(s,z) of groups and clusters at high redshift, providing constraints on m andw • Measure thesmall-scale “thermal” motions of galaxies at z~1, providing a mass scale for halo models (measuring m andbias, in the paradigm when DEEP2 was designed)
DEEP2 has been made possible by DEIMOS, a new instrument on Keck II DEIMOS (PI: Faber) and Keck provide a unique combination of wide-field multiplexing (up to 160 slitlets over a 16’x4’ field), high resolution (R~5000), spectral range (~2600 Å at highest resolution), and collecting area.
And HST ACS VI imaging finished last month! Currently reduced mosaic 0.2% of the upcoming EGS dataset
position l Finding groups in DEEP2 We find groups using the locations of galaxies in redshift space - no photometric information is used, just the overdensity in the 3d galaxy distribution. In particular, we are using the Voronoi-Delaunay Method of Marinoni et al. (2002), which has been optimized for use at high z and performs well. (For our purposes, “clusters” are just especially massive groups.) Group in early DEEP2 data
First DEEP2 Group Catalog We currently have group catalogs for 3 fields Gerke et al. 2005,astro-ph/0410721
We measure galaxy environments using projected 3rd-nearest neighbor distance, shown to be near-optimal in Cooper et al. 2005 (submitted). There are strong trends of galaxy density with restframe color and [OII] equivalent width (a proxy for star formation rate); the color trend can explain the [OII] one. Galaxy Properties and Environment log density bluecolorred [OII] equivalent width (SFR) Cooper et al. 2005
Color vs. Equivalent Width of [OII] Red galaxies have low [OII] equivalent width, while blue galaxies span a wide range. It appears that the scatter in this relation is most likely not due to environment. We are currently matching the DEEP2 colors and magnitudes to SDSS to look for evolution in environmental dependence between z=1 and z=0.
Trends from z~0 studies persist at z~1: e.g. redder or brighter galaxies are preferentially found in dense environments. Environment over the CMD SDSS, z~0.1 DEEP2, 0.75<z<1.05 redder brighter Cooper et al. 2005