Download

1 / 80
820 likes | 1.12k Views
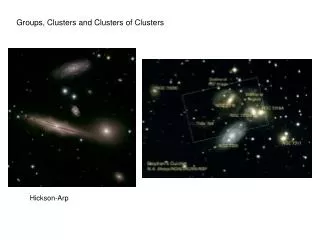
Claudia Mendes de Oliveira Instituto Astronômico e Geofísico Sao Paulo, Brazil. Clusters and groups of galaxies. Plan of this class. Why study clusters of galaxies A bit of history Galaxy morphological classification Local group, Virgo cluster, Coma cluster Cluster catalogues

E N D
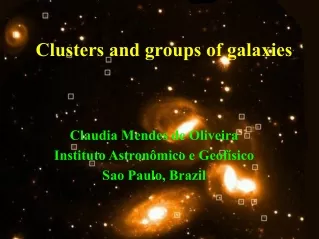
Claudia Mendes de Oliveira Instituto Astronômico e Geofísico Sao Paulo, Brazil Clusters and groups of galaxies
Plan of this class • Why study clusters of galaxies • A bit of history • Galaxy morphological classification • Local group, Virgo cluster, Coma cluster • Cluster catalogues • Populations of galaxies in nearby clusters • Luminosity functions of galaxies in clusters • cD galaxies • Dwarf galaxies • Cluster kinematics • Some physical processes which can affect galaxies in clusters • Measuring the masses of clusters
A bit of history • Charles Messier published his famous catalogue of nebulae in 1784. • He noted that: “The constellation of Virgo… is one of the constellations that contains the greatest number of nebulae” • Other similar concentrations of nebulae were found in the 18th and 19th centuries by the Herschels. • William Herschel (1785) commented on: “That remarkable collection of many hundreds of nebulae which can be seen in what I call the nebulous startum of Coma Berenices” • Other clusters of nebulae were discovered by: Wolf (1902, 1906), Lundmark (1927), Baade (1928), Christie (1929), Hubble and Humason (1931), Shapley (1934)
Hubble Constant Redshift Determination of distances
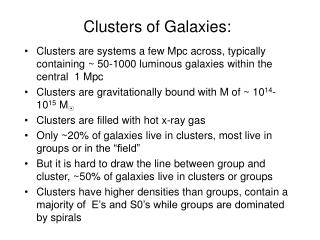
Why study clusters of galaxies? • Clusters are the largest objects in the universe to have reached a quasi-equilibrium state. • Clusters provide excellent laboratories to study galaxy formation, evolution and interactions. • Clusters provided the first and best evidence of vast quantities of dark matter in the universe. • Clusters have provided important insights into a wide range of topics, such as high-energy astrophysics, particle physics, cosmology, etc… • Clusters can be used to map the large-scale structure of the universe
10 arcmin 0.5 Mpc From talk of M. Bergmann Crete 04 Perseus z=0.018 30 arcsec RXJ0152.7-1357 z=0.83
The Coma Cluster Only 10% of the mass is visible (gas and stars)
The Cfa Slice Lei de Hubble Velocidade d=v/Ho De Lapparent et al. 1988
Model – lambda cold dark matter This image shows the hierarchical clustering in computer Simulation for lambda CDM models. The smallest structures visible are of cluster size. Clusters are still forming today! Many of them may therefore not be virialized.
Very important • Galaxy clustering is a continuous hierarchy • Any attempt to identify individual clusters requires rather arbitrary and subjective boundaries to be drawn. • There is no unique and unambiguous definition of what constitutes a cluster of galaxies, and thus no single method of identifying them. • For this reason, studies of clusters and their properties depend on the methods used to identify and catalogue them.
V~31 mag arcsec -2 Ferguson et al. 2004 A spiral galaxy Surface brightness profile of M33:
Spectrum dominated by the Emission of young stars Spectrum of a spiral Galaxy with SF
R 1/4 Elliptical galaxy
Spectrum of an old eliptical galaxy, no SF Through the line indices one can infer ages, metallicities and abundances
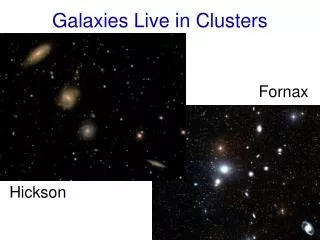
The Local Group • It has about 40 member galaxies. But several more dwarf galaxies may be undetected (particularly behind the Milky Way). • The three main galaxies of the Local Group are our own Milky Way, M31 and M33, all spirals. Most of the galaxies are dwarf galaxies. There are no elliptical galaxies in the Local Group except for M32 (not a typical elliptical). • The total mass of the Local Group is about 5 x 10¹² solar masses. • Small groups like the Local Group are the most common type of systems in the Universe
Majewski et al. (2003) The Local Group
The Virgo Cluster • It is 15 Mpc from Earth • It has several thousand galaxies • 70% of galaxies are spirals • The distribution of galaxies is clumpy • The LC is infalling towards Virgo
The Coma Cluster • Distance: 70 Mpc (z=0.02) • Brightest members are ellipticals • ~ up to 10000 members • Best-studied of all clusters
Coma provided the first evidence of dark matter in clusters Total cluster mass of 1015 solar masses The Coma Cluster
An Shectman (1985) An automated computer procedure was used to identify 646 clusters from the Lick galaxy survey Zwicky et al. (1961-1968) • Zwicky catalogued about 10000 clusters by eye • Because a less rigorous cluster definition was used, this catalogue is not as complete or homogeneous as Abell's
An APM Cluster Catalog (Dalton et al. 1992) • A different automated procedure was used • Galaxies were counted within r=0.075 h-1 Mpc • Different magnitude range • 220 clusters were cataloued Edinburgh-Durham Cluster Catalog(Lumsden et al. 1992) • An automated procedure based on Abell's cluster definition was used • 737 clusters were identified in the southern sky 2dF and SDSS cluster surveys - several
An X-ray galaxy cluster surveys • BCS, XBCS, REFLEX, EMSS, PSPC • SHARC, WARPS, MACS
Flux limits of X-ray cluster catalogues Ebeling et al. 2001 Ebeling et al. 2001
Observations of galaxies in clusters - Richness • Richness is a measure of the total number of galaxies that belong to a cluster. • “Rich” vs. “Poor” cluster • It is very difficult to determine the total galaxy populations of a cluster because: • 1) it depends on the mag. limit to which one counts • 2) clusters don't have clear boundaries • 3) There is contamination from foreground and background galaxies
Density Profiles Density profiles provide information on the radial mass distribution, which can be related to theories of cluster formation.
Density Profiles Wiggles in the profile suggest substructure is present.
Density ProfilesSeveral different functional forms have been proposed to describe density profiles. Often more than one can fit the data. • (r) = r(power – law profile) • (r) = exp [-7.67(r/re) ¼] (de Vaucouleurs profile) • (r) = [1+(r/rc)](Hubble profile) • (r) = o[1+(r/rc) 2](King profile)
Observations of galaxies in clusters – Galaxy distribution • Galaxy distributions in clusters show a wide range of morphologies, from smooth centrally-condensed to clumpy with no well-defined centroid. • Many clusters are very elongated.
Substructures • Many clusters ( about 50% or more) show substructure • Dynamical evolution will rapidly erase substructure. Therefore its prevalence indicates that many clusters have formed fairly recently. • If clusters are dynamicaly young, they may still carry clues about their initial conditions at the time of formation.
Observations of galaxies in clusters – Galaxy populations • The mixture of different galaxy types varies widely from cluster to cluster • Poor clusters have a greater fraction of S and Irr. Rich clusters have a greater percentage of elliptical galaxies.
Morphology – density relation • Galaxy type correlates with density; ellipticals are found preferentially in high-density regions
Morphology clustercentric-distance relation • Galaxy type correlates with position; ellipticals are found preferentially near the cluster center. Whitmore et al. 93
(Ellis et al; Kodama et al; Gladders et al) magnitude The colour-magnitude diagram • Clusters present the red-sequence, at low and intermediate redshifts color
Implications of the Color-magnitude relation of clusters • Lopez-Cruz et al. (2004) studied the CMR for 57 X-ray detected Abell clusters • “ Models that explain the CMR in terms of metallicity and passive evolution can naturally reproduce the observed behavior of the CMRs studied” • “The observed properties of the CMR are consistent with models in which the last episode of strong star formation in […] early-type galaxies in clusters were formed more than 7 Gyg ago”
The luminosity function of galaxies in clusters • Count number of galaxies in each bin of magnitudes
Where (L)= t he number of galaxies with luminosities L to L+dL L* = 1 x 10¹⁰ h-2 solar luminosities = -1.0 to -1.5 = 0.03 h3 Mpc-3 The luminosity function of galaxies in clusters The luminosity function isusually well-described by a Schechter form:
The luminosity function of galaxies in clusters The Schechter function, in terms of magnitudes is: