Download
1 / 17
170 likes | 280 Views
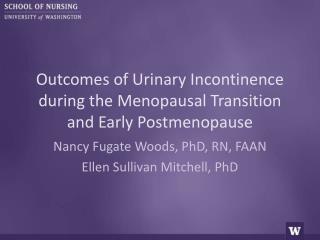
Symptom Clusters and Well-being during the Menopausal Transition and Early Postmenopause. Lori Cray, PhD, RN Nancy Fugate Woods, PhD, RN, FAAN Ellen Sullivan Mitchell , PhD Jerald R. Herting , PhD. Funding Support.

E N D
Symptom Clusters and Well-being during the Menopausal Transition and Early Postmenopause Lori Cray, PhD, RN Nancy Fugate Woods, PhD, RN, FAAN Ellen Sullivan Mitchell, PhD Jerald R. Herting, PhD
Funding Support • NINR 1R21NR012218-01 Menopause Symptom Clusters: Refocusing Therapeutics • NINR R01-NR 04141 Menopausal Transition: Biobehavioral Dimensions • NINR P30 NR 04001, P50-NR02323 – Center for Women’s Health and Gender Research
Background • Seattle Midlife Women’s Health Study (SMWHS) participants report multiple symptoms during the menopausal transition • hot flashes • sleep disturbance • pain • mood changes • cognitive difficulties • Previous analyses of SMWHS data revealed 4 clusters of symptoms women experienced during the late menopausal transition stage • Current analyses expand our research across the menopausal transition stages and early postmenopause
Purposes • Determine effects of socio-behavioral risk factors on latent class membership • Smoking • Stress • Age • Education • BMI • Determine overall effect of latent class membership on positive well-being
Sample & Design • Sample consisted of women from the SMWHS who: • provided diary data on at least one occasion between 1990 and 2010 • were in the late reproductive stage, the early or late menopausal transition stages or early postmenopause • yielded 6857 observations
Measures - Symptoms 3-day health diary
Measures – Socio-behavioral Risk Factors Stress Education Age Smoking status Body mass index (BMI) “How stressful was your day?” Scale: 0 (not at all) to 6 (extremely) Continuous variable assessed as number of years of education Continuous variable entered in years Defined by a yes/no response on annual health questionnaire Calculated according to the formula kg/m2 based on self reported height and weight collected annually in the health questionnaire
Measures –Perceived Well-being Healthy Rested Happy Interest “How healthy did you feel today?” “How rested did you feel today?” “How happy did you feel today?” “How much interest did you have today in work, school, home, friends, hobbies?” Constructed from 4 items from 3-day health diary Rated 0 (not at all) to 6(extremely)
Data Analysis Multilevel Latent Class Analysis (MLCA) C Latent class variable (i.e. symptom severity profile) • Diff. getting to sleep • Night time awakening • Early AM awakening • Backache • Joint ache • Headache • Depressed • Mood changes • Crying • Irritable • Problem concentrating • Forgetful • Irritable • Panic • Nervous • Tension Hot Flash Sleep Pain Mood Cog-nitive Tension Latent class indicators (i.e. symptom clusters)
Model No of free BIC BLRT (p) Entropy parameters 1 class 12 72669.4 NA NA 2 class 19 62670.9 .000 .924 3 class 32 57879.0 .000 .944 4 class 33 56368.3 .000 .936 5 class 40 54877.2 .000 .941 6 class 47 53360 .9 .000 .948 Data Analysis Selection of best fitting model (optimal # of latent classes) • Goodness-of-fit measures: • Bayesian information criterion (BIC) • Bootstrap likelihood ratio test (BLRT) Logical interpretation of the resulting classes
Results Low HF/mod other sx’s High HF All Low 72% 12% 16%
Conclusion • First effort to examine latent classes or clusters of symptoms over the prolonged period from late reproductive stage through early postmenopause • Women experience multiple symptoms • Symptoms tend to cluster together • We identified 3 classes of symptom episodes • Differed by symptom severity of individual symptom clusters • Age, education, stress play significant role in class membership • Perceived well-being likely to be significantly lower for women with higher symptomatology regardless of HF severity
Next Steps SC1=high HF SC2=lowHF, mod.othersx’s SC3=low severity