Download
1 / 14
140 likes | 228 Views
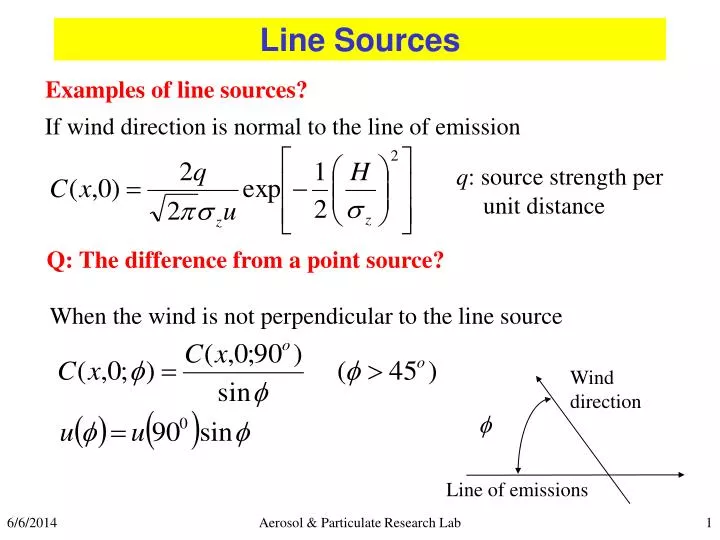
Line Sources. Examples of line sources?. If wind direction is normal to the line of emission. q : source strength per unit distance. Q: The difference from a point source?. Wind direction. f. When the wind is not perpendicular to the line source. Line of emissions.

E N D
Line Sources Examples of line sources? If wind direction is normal to the line of emission q: source strength per unit distance Q: The difference from a point source? Wind direction f When the wind is not perpendicular to the line source Line of emissions Aerosol & Particulate Research Lab
Q: Wind at 4 m/s is blowing perpendicular to the highway. Traffic density along the highway is 8000 vehicles per hour with an average vehicle speed of 40 mi/hr. The average vehicle emission rate is 210-2 g/s. Estimate the concentration at a point 300 m downwind from the highway at 5:30 pm. Aerosol & Particulate Research Lab
If the line is short, consider the end effect (FiniteLengthLineSource) Aerosol & Particulate Research Lab
Q: Given the geometry of a road segment and receptor shown in the next page and the data below, calculate the expected ground level CO concentration at the receptor. Use the two subsegments shown to get two equivalent finite length line sources, and assume a constant emission rate along each FLLS. CO emission factor = 15 g/km-vehicle, Class is D, u = 1 m/s, H = 0 m, and traffic count is 6000 vehicles per hour. Assume that y = 20 m, sz = 12 m at x = 50 m and that y = 22 m and z = 14 m at x = 67.5 m. Aerosol & Particulate Research Lab
Q: A line of burning agricultural waste is 150 m long. The emission rate is 90 g/s. The wind is blowing at 3 m/s perpendicular to the line. It’s 4 pm on a sunny fall afternoon. Estimate (a) the concentration at a distance of 400 m directly downwind from the center line; (b) the concentration directly downwind from one end of the source. Aerosol & Particulate Research Lab
Area Sources • Combining all of the emissions in a given area, treating this area as a source having an initial horizontal standard deviation, sy0=S/4.3, where S is the length of one side of the area • Determine a virtual distance, xy, for this sy0. • Use Point Source equation with syas a function of x+xy. • If the effective stack heights are different, approximate the variation by a sz0. • Determine a virtual distance, xz, for this sz0. • Use Point Source equation with szas a function of x+xz. Aerosol & Particulate Research Lab
Q: H2S is emitted from an area with 1524 m on a side. The total emission from the area is 6 g/s. The weather is thinly overcast night with wind velocity of 2.5 m/s. The average effective height is 20 m. Estimate the concentration resulting from the area at the center of the adjacent square. Q: A core melt-down of a power plant at 2 am is releasing 1.5106 curies of activity (1 s after the accident) into the atmosphere of the containment vessel. The activity decay follows (t/t0)-0.2. The reactor building is hemi-spherically shaped with r = 20 m. Assume the leak rate is 0.1% per day. The weather is clear night with wind velocity of 2.5 m/s. What is the concentration in the air 3 km directly downwind from the source at 4 am? Aerosol & Particulate Research Lab
Instantaneous Sources Aerosol & Particulate Research Lab
Fourier transform For a source at elevation H above the ground (reflection) Q: for an absorbing surface? Aerosol & Particulate Research Lab
Maximum ground level concentration at x Q: Can we use the same sy and sz? Q: How about sx? Aerosol & Particulate Research Lab
Q: How would the concentration at a location as a function of time look like? Q: How to determine the time to reach the max. concentration? Average concentrations from Instantaneous Sources N: Half the number of standard deviation that pass the receptor during the averaging time A: cumulative area under the normal curve to N derivatives using Table 4.1 on Slide 4 F: correction factor Aerosol & Particulate Research Lab
Q: 5 kg of air toxic was accidentally released at 8 pm (1 hour after sunset). The release was considered instantaneous and at ground level. The level of concern (LOC) is 1250 mg/m3 for 30 minutes exposure. The nearest distance to the property line from the accident location is 400 m. At the time of the release, the sky was 2/10 cloud and 10-meter wind was 4 m/s. Were the concentrations exceeding the LOC likely to have occurred off property? If they do, to what distance do we need to be concerned? Assume x = y. In determining a transport wind, assume that a wind for a height of 2 m above ground would be appropriate. Aerosol & Particulate Research Lab
Summary Take 2 minutes to summarize here what you have learned from this section Aerosol & Particulate Research Lab