Download
1 / 1
10 likes | 181 Views
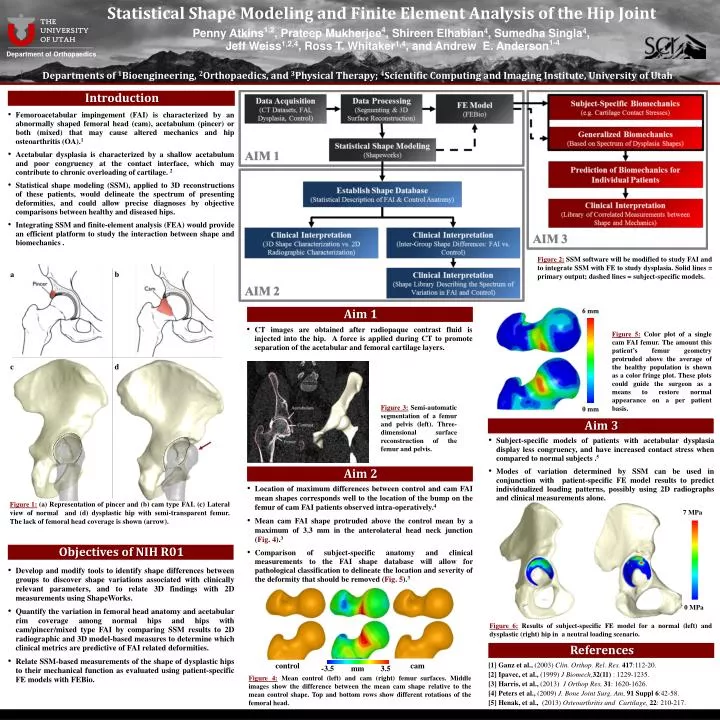
Statistical Shape Modeling and Finite Element Analysis of the Hip Joint. THE UNIVERSITY OF UTAH. 6 mm. Penny Atkins 1,2 , Prateep Mukherjee 4 , Shireen Elhabian 4 , Sumedha Singla 4 , Jeff Weiss 1,2,4 , Ross T. Whitaker 1,4 , and Andrew E. Anderson 1-4. Department of Orthopaedics.

E N D
Statistical Shape Modeling and Finite Element Analysis of the Hip Joint THE UNIVERSITY OF UTAH 6 mm Penny Atkins1,2, Prateep Mukherjee4, Shireen Elhabian4, Sumedha Singla4, Jeff Weiss1,2,4, Ross T. Whitaker1,4, and Andrew E. Anderson1-4 Department of Orthopaedics Departments of 1Bioengineering, 2Orthopaedics, and 3Physical Therapy; 4Scientific Computing and Imaging Institute, University of Utah control cam -3.5 mm 3.5 0 mm Introduction • Femoroacetabular impingement (FAI) is characterized by an abnormally shaped femoral head (cam), acetabulum (pincer) or both (mixed) that may cause altered mechanics and hip osteoarthritis (OA).1 • Acetabular dysplasia is characterized by a shallow acetabulum and poor congruency at the contact interface, which may contribute to chronic overloading of cartilage. 2 • Statistical shape modeling (SSM), applied to 3D reconstructions of these patients, would delineate the spectrum of presenting deformities, and could allow precise diagnoses by objective comparisons between healthy and diseased hips. • Integrating SSM and finite-element analysis (FEA) would provide an efficient platform to study the interaction between shape and biomechanics . Figure 2:SSM software will be modified to study FAI and to integrate SSM with FE to study dysplasia. Solid lines = primary output; dashed lines = subject-specific models. a b Aim 1 • CT images are obtained after radiopaque contrast fluid is injected into the hip. A force is applied during CT to promote separation of the acetabular and femoral cartilage layers. Figure 5:Color plot of a single cam FAI femur. The amount this patient’s femur geometry protruded above the average of the healthy population is shown as a color fringe plot. These plots could guide the surgeon as a means to restore normal appearance on a per patient basis. c d Figure 3: Semi-automatic segmentation of a femur and pelvis (left). Three-dimensional surface reconstruction of the femur and pelvis. Aim 3 • Subject-specific models of patients with acetabular dysplasia display less congruency, and have increased contact stress when compared to normal subjects .5 • Modes of variation determined by SSM can be used in conjunction with patient-specific FE model results to predict individualized loading patterns, possibly using 2D radiographs and clinical measurementsalone. Aim 2 • Location of maximum differences between control and cam FAI mean shapes corresponds well to the location of the bump on the femur of cam FAI patients observed intra-operatively.4 • Mean cam FAI shape protruded above the control mean by a maximum of 3.3 mm in the anterolateral head neck junction (Fig. 4).3 • Comparison of subject-specific anatomy and clinical measurements to the FAI shape database will allow for pathological classification to delineate the location and severity of the deformity that should be removed (Fig. 5).3 Figure 1:(a) Representation of pincer and (b) cam type FAI. (c) Lateral view of normal and (d) dysplastic hip with semi-transparent femur. The lack of femoral head coverage is shown (arrow). 7 MPa Objectives of NIH R01 • Develop and modify tools to identify shape differences between groups to discover shape variations associated with clinically relevant parameters, and to relate 3D findings with 2D measurements using ShapeWorks. • Quantify the variation in femoral head anatomy and acetabular rim coverage among normal hips and hips with cam/pincer/mixed type FAI by comparing SSM results to 2D radiographic and 3D model-based measures to determine which clinical metrics are predictive of FAI related deformities. • Relate SSM-based measurements of the shape of dysplastic hips to their mechanical function as evaluated using patient-specific FE models with FEBio. 0 MPa Figure 6: Results of subject-specific FE model for a normal (left) and dysplastic (right) hip in a neutral loading scenario. References [1] Ganz et al., (2003)Clin. Orthop. Rel. Res.417:112-20. [2] Ipavec, et al., (1999) J Biomech,32(11) : 1229-1235. [3] Harris, et al., (2013) J Orthop Res, 31: 1620-1626. [4] Peters et al., (2009) J. Bone Joint Surg. Am, 91 Suppl 6:42-58. [5] Henak, et al., (2013) Osteoarthritis and Cartilage, 22: 210-217. Figure 4:Mean control (left) and cam (right) femur surfaces. Middle images show the difference between the mean cam shape relative to the mean control shape. Top and bottom rows show different rotations of the femoral head.