Download
1 / 23
250 likes | 427 Views
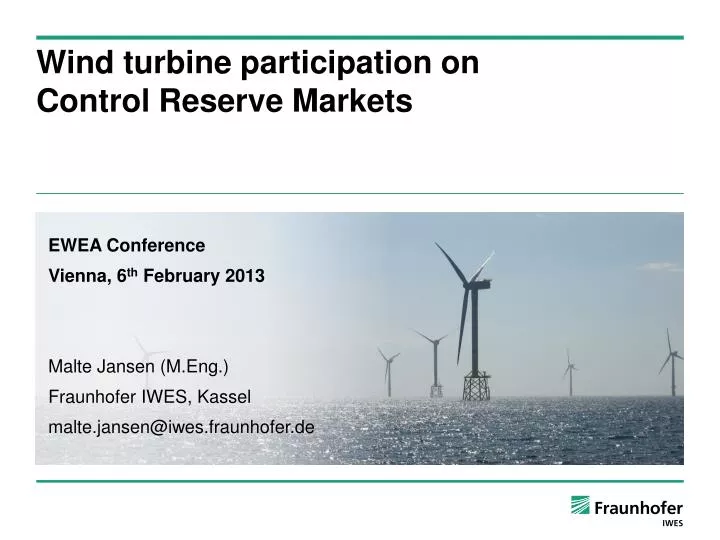
Wind turbine participation on Control Reserve Markets. EWEA Conference Vienna, 6 th February 2013 Malte Jansen ( M.Eng.) Fraunhofer IWES, Kassel malte.jansen@iwes.fraunhofer.de. Regulator. TSO. Player. Manufacturer. Supplier. Research Institutions. European countries.

E N D
Wind turbine participation onControl Reserve Markets • EWEA Conference • Vienna, 6thFebruary 2013 • Malte Jansen (M.Eng.) • Fraunhofer IWES, Kassel • malte.jansen@iwes.fraunhofer.de
Regulator TSO Player Manufacturer Supplier Research Institutions European countries
Project: „Regelenergie durch Windkraftanlagen“ 0.9 Actual Feed-In Project Partners: • Fraunhofer IWES (Project Leader) • ENERCON GmbH (WT Manufacturer) • Energiequelle GmbH (WF Operator) • Amprion GmbH (TSO) • TenneT GmbH (TSO) Project Period: • 05/2012 – 04/2014 Aims: • ProofProcedure • Placement ofoffers • Unit control 0.8 Forecast: 95% Forecast: 99% 0.7 Forecast: 99.9% Forecast: 99.99% 0.6 Forecast: 99.999% 0.5 Power (normalized) 0.4 0.3 0.2 0.1 0 09-Nov 16:45 11-Nov 15:15 13-Nov 13:45 15-Nov 12:15 17-Nov 10:45 19-Nov 09:15 Time
Offer (I) - Security level Reliability of 100% required Not possible for wind farms Reliability level of 99.994% used in the project (TSO recommendation) Use of probabilistic wind power forecasts Probability Power
Offer (III) - Pooling ofwind farmswithconventionalgeneration • Use of probabilistic forecast • Probabilistic forecast error is convoluted • Wind farms • Conventional generation • Offer = Power at a security level of 99.994% Pool offering control reserve @ 99.994%
Offer (IV) - Effectsof Pooling Pool Wind Farms Pool Gasturbines 700 Sum of both Pools Joint offering (convoluted) 600 500 Maximum Offer [MW] 400 300 200 100 0 0 20 40 60 80 100 120 140 160 180 200 Time [1/4 hours]
Proof Method (I) – Balance control mechanism Available active power • Currently applied • TWENTIES Project Demo#1 (Spain) • Regulation in Great Britain and Denmark Forecast Forecast Power output [MW] • Prob. Forecast @ x% • Prob. Forecast @ x% • delivery of negative control reserve Feed-In Feed-In 0 15 30 Time [min]
Proof Method (II) – Available active power mechanism Available active power Forecast • delivery of negative control reserve Forecast Power output [MW] • Prob. Forecast @ x% • Prob. Forecast @ x% Feed-In • Field test in the project „RegelenergiedurchWindkraftanlagen“ • Regulation in the Irish and Danish Grid Code • Considered as proof method in Great Britain 0 15 30 Time [min]
Why available active power? Balancing effects between balancing groups Shortterm forecast error of wind farms is balanced by control reserve Planned power production = available active power Not opinion of all project partners!
EnergyLosseswiththebalancecontrolmechanism – German poolof wind farms Lost energy with offers under schedule proof mechanism (German Pool) 1200 1000 800 24 Hours 600 4 Hours Lost energy per hour offered [MWh\h_offered] 1 Hour 400 200 95% 99% 99.8% 99.9% 99.99% 99.994% 99.999% 0 Security level
Capacitypriceswiththebalancecontrolmechanism– German poolof wind farms Capacity Prices under the schedule proof mechanism (German Pool) 80 70 60 50 24 Hours • Capacity Prices [€/MW/h] 4 Hours Capacity costs of control reserve under the available active power mechanism is 0 €/MW/h 1 Hour 40 30 20 10 0 95% 99% 99.8% 99.9% 99.99% 99.994% 99.999% Security level
Comparison of costsavingpotentialsat the tertiary control reserve market • 1h Product length x 106 16 • Cost-saving potential: • Availableactive power • Increasedcostefficiencycomparedtobalancecontrol • Costreduction • +212% @ 95% • +404% @ 99.999% • Higher marketshareof wind farms Available active power Balance control 14 12 10 Cost Reduction [€] 8 6 4 2 0 95% 99% 99.8% 99.9% 99.99% 99.994% 99.999% Security Level
Potentials (I) – Potentials under different parameters • Variation ofinputparameters • Security level • Block length • Biddingstrategy • Trade-off • System security • Economicefficiency Power (normalized) 0.3 0.25 0.2 00:00 04:00 08:00 12:00 16:00 20:00 0.15 Time 0.1 0.05 Actualfeed-in Secure day-aheadforecast Secure intradayforecast Offercontrolreserve
Potentials (II) – German pool of wind farms, Day-Ahead Tendering (1st July 2010 – 31st Dec 2010) x 106 14 95% 99% 12 99,8% 99,9% 10 99,99% 99,994% 99,999% 8 Potential [MWh] 6 4 2 0 1h 4h 24h Product length
Potentials (III) – Ecomonicimpact on thetertiarycontrolmarketofthe German wind farmpool (1st July – 31st Dec 2010) Resultsforteriarysecondaryreservebids / availableactive power proofmethod x 106 16 • 24 hour product length • 4 hour product length 12 • 1 hour product length Maximum – No additional income for wind farms Cost Reduction [€] 8 4 • Minimum – Maximum additional income for wind farms 0 95 % 99 % 99.8 % 99.9 % 99.99 % 99.994 % 99.999 % Security Level
Field test Secondary control Tertiary control 1 Positivecontrol reserve 0.5 Energyfrom Unit [MW / Mwoffered] 0 • 45 • 40 • 15 • 10 • 5 • 50 • 20 • 25 • 60 • 35 • 30 • 55 -0.5 Negative control reserve -1 Pro-tocol Real Signal Protocol Real Signal
Conclusions • Wind Farm participation in control reserve markets … • is economically feasible • can substitute fossil fuel fired power plants • will increase competition in the market • can generate additional revenue for the wind farm operators • Balance control proof mechanism is unfavourable • In economic terms • In terms of curtailed energy Balance control proof mechanism is favourable • In terms of control reserve demand for the TSO
Malte Jansen malte.jansen@iwes.fraunhofer.de ThankyouforYourAttention!Visitusat Booth b-B77