Download
1 / 20
200 likes | 253 Views
Overview CrownGeo Standardized Data Lateral Analysis.

E N D
Overview CrownGeo Standardized Data Lateral Analysis This booklet is designed as a review or introductory level tutorial covering Crown Geochemistry, Inc.’s Lateral Analysis package, and specifically the Standardized Data page of that report. The standardized data charts are not completely uniform. This booklet uses the example of the most common of the current set of charts. Some specific situations warrant that the charts be modified a bit to test possibilities presented by the curve data for an individual well, or for an exploration region or type. The general format of this page is designed to demonstrate a test or an evaluation of a principle by contrasting two or more specific examples that might represent that principle and it’s antithesis. Another method would be to chart a pair of curves which should correlate under a test condition. For instance; methane should correlate to helium. Porosity alone can be said to control the local distribution of helium, and methane is the most similar HC in that respect. In testing whether a fault or other conduit were affecting the local gas population these (He and C1) might be paired to test gas equilibrium, and one or both of these might then be contrasted to some species comprised of larger molecules to test whether one or the other were in greater or lesser supply than should be the case if there were no communication conduit away from the main compartmental system. Other items concepts may be examined in this way as well, among them Sw variability, compartmental boundaries, and G/O/W boundaries. The following slides demonstrate examples commonly employed in this section of the lateral analysis report. Email questions regarding this or any Crown Geochemistry presentation to info@crowngeo.com Calls are welcome as well, 9am to 4pm central, at 580.562.4670 Crown GeoChemistry, Inc.
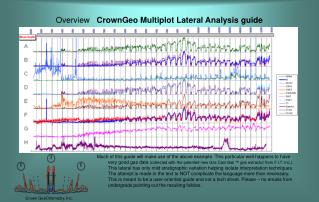
Overview CrownGeo Standardized Data Lateral Analysis Much of this guide will make use of the above (and the following) example. This particular well happens to have very good gas data (collected with the patented new Gas Cannibal ™ gas extractor from F.I.T. Inc.). This lateral has only mild stratigraphic variation helping isolate interpretation techniques. The attempt is made in the text to NOT complicate the language more than necessary. This is meant to be a user-oriented guide and not a tech sheet. Please – feel free to email with direct questions - if we can help clear up what the attempt at layman’s language may have made difficult or unclear. Crown GeoChemistry, Inc. • Std C1/Std FPH • Std Benz/Std nC6 • Std C1/Std CO2 • Std C1/Std C4 • Std He/Std H2
Overview CrownGeo Standardized Data Lateral Analysis • Std FPH Much of this guide will make use of the above (and the prior) example. They are curve data from a nice data set with that curve data transformed into standard deviation values for each point in each curve. Both charts are set on one page of the standard lateral analysis report. Again - this particular well happens to have very good gas data (collected with the patented new Gas Cannibal ™ gas extractor from F.I.T. Inc.), and this lateral has only mild stratigraphic variation helping isolate interpretation techniques. More on how to make use of these charts later…. • Std C1 • 3σ • Std Benz • 2σ • Std C6 • 1σ • Std C4 • μ • -1σ • -2σ • -3σ Crown GeoChemistry, Inc.
Term review CrownGeo Standardized Data Lateral Analysis For a quick layman’s review of how we standardize data in these plots we’ll make use of the above chart which is excerpted from Wikipedia.org coverage of the term “normal distribution” within the topic of statistics. Given that a set of numbers (like methane values along a wellbore) that are related could distribute in what is called a “bell curve” distribution we can use population statistics to normalize the numbers to another set of numbers (like propane values along a well bore) which have different real values for comparison of relative values. Crown GeoChemistry, Inc.
Term review CrownGeo Standardized Data Lateral Analysis The average value for methane would probably be a background gas reading in about the middle of a lateral wellbore. The average value background gas readings would then be converted to a value in this example of 0 standard deviations. The very highest recorded methane values at the right end of the chart might all be for trip gas values. Each of these highest values would be converted in this example to about+3 std deviations. In this way values all along the well bore are converted to their relative values. By doing propane in the same manner we would be able to compare where the values for one compared as stronger or weaker relative to the other by plotting these converted values as curve data, which would thereby be scaled alike. Number of entries at each value Increasing methane values Crown GeoChemistry, Inc.
Std 2 CrownGeo Standardized Data Lateral Analysis • Std FPH This is an example of the chart at the top of this page of the report. We refer to this as Std Dev Chart 2. The species displayed are labeled on the right margin and the Std Dev scale is on the left margin. In following slides we will average this data a bit to clarify the curves to general trends for illustration purposes. Note that the displayed species are ROP, and several hydrocarbons (HC). Note also that ROP before the 8600’ point is very slow and that methane effectively correlates to ROP - including jumping up in value about where and about as much as ROP does. • Std C1 • 3σ • Std Benz • 2σ • Std C6 • 1σ • Std C4 • μ • -1σ • -2σ • -3σ Crown GeoChemistry, Inc.
Std 2 CrownGeo Standardized Data Lateral Analysis • Std FPH The circled inset highlights a portion of the data where the HCs remarkably outperform expectations which ROP would have suggested. The HCs that are part of this anomaly are ALL of the HCs. This would perhaps not be the case if this were not a sourcerock shale, or if the anomaly were a result of Sw variability for instance; which could affect certain species disproportionately. Note also that the range that the HCs outperform ROP is about the same. • Std C1 • 3σ • Std Benz • 2σ • Std C6 • 1σ • Std C4 • μ • -1σ • -2σ • -3σ Crown GeoChemistry, Inc.
Std 2 CrownGeo Standardized Data Lateral Analysis • Std FPH This circled inset highlights a portion of the data where the HCs apparent volume drops very low. But so does ROP and the data for different produced HCs drops about the same as ROP does. This is nothing but that the drilling rate was reduced thus dropping the sample amounts arriving at the surface. • Std C1 • 3σ • Std Benz • 2σ • Std C6 • 1σ • Std C4 • μ • -1σ • -2σ • -3σ Crown GeoChemistry, Inc.
Std 2 CrownGeo Standardized Data Lateral Analysis • Trend FPH Not to beat a dead horse – but the above is the same data, averaged a bit more as trend lines. In the following plate we will display less of the same. Keep your eyes on the curves as you move to the next slide. • Trend C1 • 3σ • Trend Benz • 2σ • Trend C6 • 1σ • Trend C4 • μ • -1σ • -2σ • -3σ Crown GeoChemistry, Inc.
Std 2 CrownGeo Standardized Data Lateral Analysis • Trend FPH All we have done is remove benzene and butane, leaving a smaller molecule HC and a larger molecule HC to be compared against ROP. Sometimes it is helpful to compare other concepts in this fashion, such as propensity to Sw, or to compare organic vs. inorganic species. • Trend C1 • Trend C6 • 3σ • 2σ • 1σ • μ • -1σ • -2σ • -3σ Crown GeoChemistry, Inc.
Std 2 CrownGeo Standardized Data Lateral Analysis • Trend FPH Back to “all we have done is remove benzene and butane”. Since these curves are averaged a bit more the curve deflections suggest a wider affected area than the original data did in slide 7. The thing to make note of is that HC data for both smaller and larger HCs are well above trend in this portion of the lateral. • Trend C1 • Trend C6 • 3σ • 2σ • 1σ • μ • -1σ • -2σ • -3σ Crown GeoChemistry, Inc.
Std 2 CrownGeo Standardized Data Lateral Analysis • Trend FPH A general expectation is met that the apparent volume of HCs will increase as the wellbore lengthens. This blue line is about the slope of the increase in value that the HC components in this well increased at. In the next slide this will be shown again on the original chart. As a general rule the lengthening lateral will have the HC gas values demonstrate this type of “ramp” for increasing apparent HC volume. • Trend C1 • Trend C6 • 3σ • 2σ • 1σ • μ • -1σ • -2σ • -3σ Crown GeoChemistry, Inc.
Std 2 CrownGeo Standardized Data Lateral Analysis • Std FPH So here it all is, back into one slide. It is evident how widely the circled inset was averaged in the trend versions of the same data. In context with other “local lore” this particular gas increase feature (red circle) might happen to be an example of increased microfracturing, and the gas dip (pink circle) is not something that would suggest that portion to underperform in eventual gas delivery. The boundary at about the green arrow bar is at an apparent stratigraphic change. All three points are examples of being able to evaluate data based on testing one concept against another. • Std C1 • 3σ • Std Benz • 2σ • Std C6 • 1σ • Std C4 • μ • -1σ • -2σ • -3σ Crown GeoChemistry, Inc.
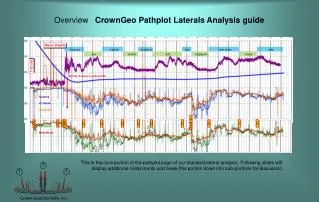
Std 1 CrownGeo Standardized Data Lateral Analysis Looking at the chart which would typically be labeled as Std Dev 1 we present several curves which display the ratio of one std dev curve to another. The top curve is the ratio of C1 to ROP. Since ROP is the speed at which well sample is delivered to be sampled this curve is useful in determining when a gas increase may simply be a sample rate increase due to ROP. In this way concepts can be evaluated against each other; Benz/nC6 can be indicative of Sw , C1/CO2 tests for CO2 irregularities, C1/C4 for relative poro/perm variation in tight rock, and He/H2 for irregularites in either, which could be related to frac/faulting and poro/perm variation. Any may be instructive of compartmental changes. Increasing ratio proportion of first component “Heel” Increasing depth “Toe” Crown GeoChemistry, Inc. • Std C1/Std FPH • Std Benz/Std nC6 • Std C1/Std CO2 • Std C1/Std C4 • Std He/Std H2
Std 1 CrownGeo Standardized Data Lateral Analysis The top curve is the ratio of C1 to ROP. Since ROP effectively is the the speed at which well sample is delivered to be sampled, this curve is useful in determining when a gas apparent volume increase may simply be a sample rate increase due to ROP. The data selected inside the circle represents an area where the C1 value is increased relative to ROP. This is the same portion of the same well used in the red circle example for the other chart. For example you might crush rock with the bit into the mud so that it flows across the surface to be measured as 1000 ppm while you are drilling at 10 feet per hour (FPH). If the same rock with the same gas content is drilled at 20 FPH then a reading at the surface would be expected to be 2000 ppm because the dose applied is twice as rich given that the circulation rate of the mud is constant. A gas value increase is not in and of itself indicative of higher geologic gas content. • Std C1/Std FPH • Std Benz/Std nC6 Increasing proportion of first component Crown GeoChemistry, Inc.
Std 1 CrownGeo Standardized Data Lateral Analysis Benzene and Hexane. The simple observation is that this ratio slopes upward over distance. Due to factors which include solubility differences this ratio increases for Benzene over the section. At a bit trip the mud lies still at the surface for long enough that both species dissipate noticeably and the value resets lower in a sawtooth-like drop. Given the normal "ramp" as is evident here, variation from this normal behaviour can be indicative of increased Sw. That relationship to Sw is established in the literature and is easy to research, but in a nutshell; virtually all benzene becomes associated with water over geologic time. Comparing benzene to another C6 has worked well as an Sw indicator, but comparing it to toluene is also done instead. In shale laterals there is usually not much Sw variation, and since both are supplied by the source rock, the data in shale is also very useful as a quality control since the ramp for this ratio is so constant. • Std Benz/Std nC6 Increasing proportion of first component “Heel” Increasing depth “Toe” Crown GeoChemistry, Inc.
Std 1 CrownGeo Standardized Data Lateral Analysis CO2 can be geologic in origin but is not always and there is, of course, CO2 present in the air. Increasing amounts of methane over length of section with CO2 as an atmospheric constant should look approximately as it does here. Variations in the C1/CO2 curve can help the analyst establish points to test for compartmental and for frac/fault changes. Since the drilling mud may produce CO2 this curve can help indicate an affected well section. • Std C1/Std CO2 Increasing ratio proportion of first component “Heel” Increasing depth “Toe” Crown GeoChemistry, Inc.
Std 1 CrownGeo Standardized Data Lateral Analysis • Std C1/Std C4 Several factors combine to create this downward slope for C1/C4. For methane the "not retained to the mud by solubility" percentage plus the "not measured below detection limits" portion combined and then subtracted from methane's true absolute value would produce a number that would round off to about 100% of true methane. Methane is just so abundant that these influences are relatively miniscule. For the relatively scarce propane that is all less true. As a lateral well lengthens the length of exposed section contributing sample grows and the produced HC vaues "ramp" gently upward. Since propane was disproportionately masked at the beginning and less so as the values get higher the ratio of almost unaffected methane to this scarcer item appears to drop. This is sample from a super-mature source and there is effectively no propane. The downward sloping ramp here is normal. Unlike this example the data could exhibit variability in the ratio that was not part of the standard “ramp decline” and be indicative of such as compartmental or bedding variation, secondary porosity, fault/fracture variation, etc.. Increasing proportion of first component “Heel” Increasing depth “Toe” Crown GeoChemistry, Inc.
Std 1 CrownGeo Standardized Data Lateral Analysis Hydrogen is one of the species that an analyst should be cautious of. Hydrogen can be made or removed by the mud system. The heat of failing bearings in bits and downhole motors can help catalyze hydrogen as well. But helium is completely the opposite. Helium read here is geologic in origin. Helium should covary with methane in most cases. When hydrogen is performing “normally” helium relative to hydrogen can be useful in detecting compartmental and or stratigraphic variation. It is also useful to examine helium relative to other inorganic species and to light hydrocarbons in suggesting places to examine for fault/frac evidence. • Std He/Std H2 Increasing ratio proportion of first component “Heel” Increasing depth “Toe” Crown GeoChemistry, Inc.
Summary CrownGeo Standardized Data Lateral Analysis The standardized data presentation is simply a way to demonstrate the relative strengths of different pairs of items. By using the scaling technique as described herein this data is simply easier to visualize graphically. The particular examples contained here were compiled from an actual data set, which is DQ1000 ™ data from a fairly gas mature shale lateral. In other wells different items or HC species may be compared/contrasted in order to evaluate different concerns, but the general method would be about as described here. Some of our customers evaluate the raw data, but most of our customers never test the data themselves. They rely on us to make our standard report and this explanation of the Std Dev page of our report is designed to help customers understand some of what we are doing for them and how we do it. Any feedback concerning this booklet would be sincerely appreciated. Email questions regarding this or any Crown Geochemistry presentation to info@crowngeo.com Calls are welcome as well, 9am to 4pm central, at 580.562.4670 Crown GeoChemistry, Inc.