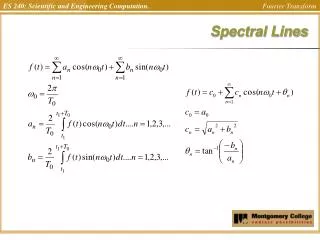
Download
1 / 11
120 likes | 270 Views
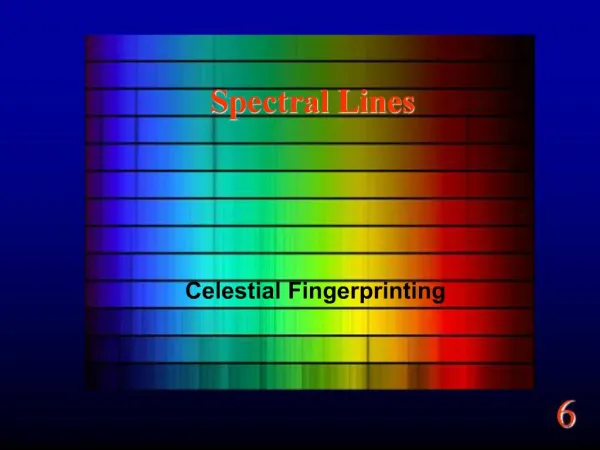
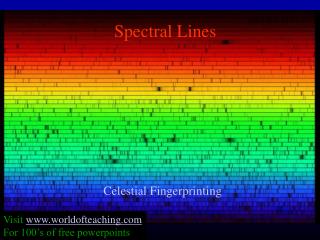
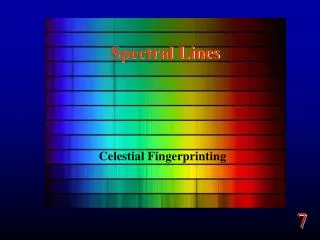
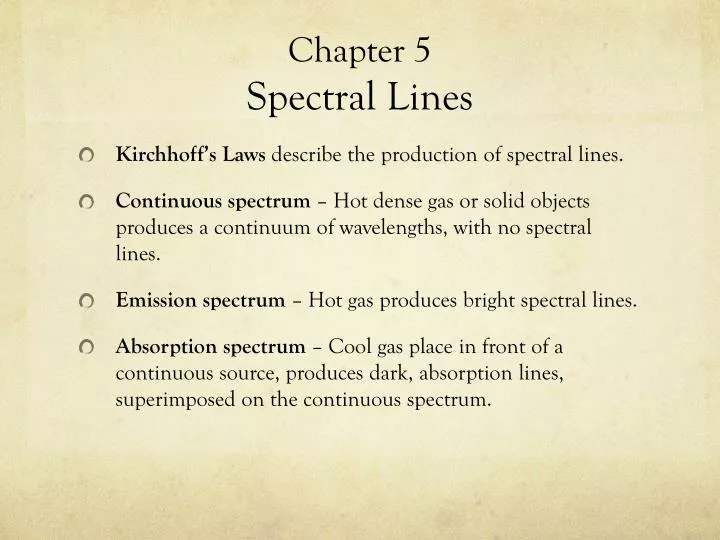
Chapter 5 Spectral Lines. Kirchhoff’s Laws describe the p roduction of spectral lines. Continuous spectrum – Hot dense gas or solid objects produces a continuum of wavelengths, with no spectral lines. Emission spectrum – Hot gas produces bright spectral lines.

E N D
Chapter 5Spectral Lines • Kirchhoff’s Laws describe the production of spectral lines. • Continuous spectrum – Hot dense gas or solid objects produces a continuum of wavelengths, with no spectral lines. • Emission spectrum – Hot gas produces bright spectral lines. • Absorption spectrum – Cool gas place in front of a continuous source, produces dark, absorption lines, superimposed on the continuous spectrum.
Spectral Lines • Stellar counterparts of Kirchhoff’s Laws • Continuous spectrum – This is produced by the layer of hot, dense gas just below a star’s photosphere. • Emission spectrum – These lines are produced in stars with very hot, expanding photospheres, such as in novae, supernovae, and Wolf-Rayets. • Absorption spectrum – These lines are produced in the photospheres of the vast number of stars.
Spectrographs • In general, spectrographs use a reflection diffraction grating to disperse the incoming light. The grating equation is: • d sin q = nl • where d is the groove spacing, • n is the order (n=0 is the zeroth order). Spectra are taken with n=1, the first order. • l is the wavelength
Spectrographs • Specs of CSM’s SGS spectrograph are: • Resolution 2.2 A • Grating 600 lines/mm • Dispersion1.06 A/pixel • Camera used is SBIG ST-7XME • Wavelength range is 3800 to 7500 A
Spectrographs • The SGS spectrograph on the Meade 8”, w/CCD camera.
Spectrographs • SBIG Spectrograph – showing the 600 lines/mm diffraction grating.
Spectrographs • SBIG Spectrograph – showing the innards
Low Resolution Grating Spectrographs • In addition to the high resolution spectrographs, there are now low res spectrographs, using just transmission diffraction grating. The two in use are the Star Analyzer (SA), a 100 l/m grating and the Rainbow Optics (RO), a 200 l/mm grating. Pictured below is the SA.
Low Resolution Grating Spectrographs • These gratings are mounted in a filter wheel, attached to the CCD camera. An example of the usage of the SA filter is this spectrum of SN2014J taken by Alex Chassy. The pronounced dip near the center of the spectrum is the absorption line, due to Si II. That is characteristic of a Type Ia supernova.
Low Resolution Grating Spectrographs • Here is the image of SN2014J in M82, also taken by Alex Chassy.