Download
1 / 35
350 likes | 422 Views
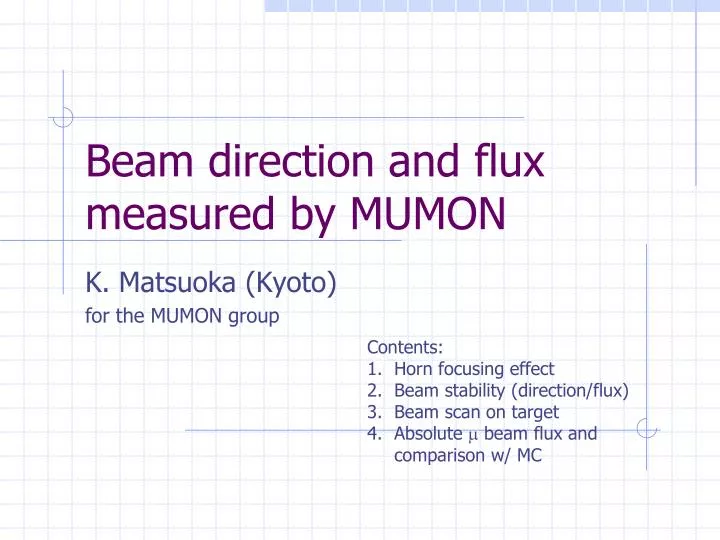
Beam direction and flux measured by MUMON. K. Matsuoka (Kyoto) for the MUMON group. Contents: Horn focusing effect Beam stability (direction/flux) Beam scan on target Absolute m beam flux and comparison w/ MC. Neutrino beam direction.

E N D
Beam direction and flux measured by MUMON K. Matsuoka (Kyoto) for the MUMON group Contents: Horn focusing effect Beam stability (direction/flux) Beam scan on target Absolute m beam flux and comparison w/ MC
Neutrino beam direction • Measure (n) beam direction by measuring muon profile center. (Another end is target) • 1-mrad shift of the beam direction corresponds to 11.8-cm shift of the MUMON profile center. • Requirement for MUMON: 3-cm=0.3mrad precision Horns OTR p Beam dump nm 2.5˚ 295 km p Target Baffle m 118 m MUMON
Basic Analysis method • analysis has done by simple charge integration & 2D Gaussian fitting. • for both online/offline analysis wave form x 49 Silicon 80 mV for 3 x 10¹¹ ppp Gate Pedestal in some analysis, we also use total charge of 49 ch
Confirmation of Horn focusing 3 horns, 320 kA(shot# 47577), 2.16 x 10¹² ppb, 6 bunch 1st horn, 275 kA(shot# 47987), 2.10 x 10¹² ppb, 6 bunch no horn, 0 kA(shot# 48704), 2.13 x 10¹² ppb, 6 bunch peak sigma peak sigma 1547 pC 83 cm 38.5 pC 90 cm 467 pC 95 cm 13.2 pC 104 cm 218 pC 110 cm 6.29 pC 126 cm x7.1 x2.1
Stability of the beam direction • Monitor the profile center obtained by the 2D Gaussian fit. • During continuous 425 shots (Run: 280136) • With 3 horns operation at 320 kA. • Proton beam intensity (CT05): 2.15 x 1012 ppb x 6 bunches * 30-dB attenuators was used for the silicons.
stability (center position) Si, X center IC, X center RMS = 4.3 mm RMS = 2.9 mm Center values are different by ~1cm. Need check! Si, Y center IC, Y center RMS = 2.3 mm RMS = 1.8 mm
center position fluctuation • Si • X : 2.9 mm (1.2 mm from Si noise) 2.6 mm from beam ? • Y : 1.8 mm (1.1 mm from Si noise) • 1.4 mm from beam ? • IC • X : 4.3 mm (3.1 mm from IC noise) • 3.0 mm from beam ? • Y : 2.3 mm (1.6 mm from IC noise) • 1.7 mm from beam ?
Stability (beam direction) (MUMON center)/(Dist.from target) √ (x2 + y2) Beam axis • No time dependent drift • Beam direction was tuned well within 1 mrad. • Monitor alignment should be checked. • Further turning in Jan.
Stability (flux)incl. stability of beam+horn field+MUMON Silicon Chamber RMS/Mean: 0.8% RMS/Mean: 0.8%
stability (flux)CT normalized • stability : 0.5% RMS • CT stability : 0.5% (from Shibata-san’s talk) • MUMON measurement error : 0.06 % (Si) & 0.14 % (IC) (estimated from pedestal RMS of this RUN) consistent with CT stability RMS : 0.5 % RMS : 0.5 %
Si / IC stability • RMS = 0.18 % • consistent with estimated measurement error ( 0.06%(Si) + 0.14%(IC) = 0.15% ) RMS : 0.18 %
Stability (flux) incl. beam+horn field+MUMON No time dependent drift
Beam scan on target • Only horn-off data in Nov/Dec commissioning (1st horn 273kA data in April/May commissioning) • Scan w/ all horns will be in Jan/Feb. • Opposite direction shift is expected. x target Proton beam were intended to shift in parallel. But angle change also existed
Beam scan on target- Center position- • MUMON alignment? • Beam angle effect? (0.3mrad) • Target alignment? • SSEM18-19 alignment?
Beam scan on target-Muon yield- Target center may be at -0.5~-1mm?? Peak charge Total Charge baffle Gap btw. Baffle and target? P beam target f30mm f26mm
Absolute muon flux estimation • Two methodsin addition to the emulsion measurement • Energy deposit calculation by MC. • Get the relation btw. muon flux and energy deposit in the detector • Calibration by electron beam test Under study. Preliminary result is showing consistent result w/ A)
Estimation from MC energy deposit Energy deposit by all particles is summed up and divided by #muons Contrib. from d-rays generated outside detector and escape of d-rays generated inside detector are (automatically) taken into account • Edep = 2420 MeV/(15266 muons) = 158.5 keV/muon • Ionization yield: Q = Edep / 3.6 eV x e0 = =7.045 x 10⁻³ pC/muon Energy deposition in the silicon (MC) 2420 MeV • *Relying on estimation of d-ray contribution by Geant3. • Bare Si measurement confirmed that the d-ray contribution is robust(~1% effect) against materials around.
Comparison w/ MC (slice histogram) Spill 622787 Horn 0 kA Spill 621503 1st horn 273 kA Data sx: 120.4 cm MC sx: 127.9±3.7 cm Data sx: 95.0 cm MC sx: 107.7±1.3 cm Data sx: 69.7 cm MC sx: 84.6±0.6 cm Error is still under study. 3 horns 320 kA Spill 332358
Profile comparisonData / MC (09c with emulsion shots) MC 273kA data 220kA 0kA
Summary • Horn focusing effect • Beam direction • Tuned within 1 mrad (and will be further tuned.) • Less than 0.03mrad (rms) fluctuation • Beam flux • <0.5% (RMS) fluctuation (maybe 0.06%) • Target scan Horn-off data for target center determination Need more study to understand the obtained results Horn-on data will be taken in Jan./Feb. • Absolute muon flux estimations and comparison w/ MC Agree with the emulsion measurement.
Stability of the proton beam RMS: 0.2 mm • Run: 280136 • Cont. 6-bunch operation • Inc. monitor stability • Stability of CT: 0.5% (Shibata-san’s talk) RMS/Mean: 0.9% RMS: 0.1 mm
total charge error estimation 1 integrate 37 bins from gate start (1-bunch length) & sum up 49 ch RMS 172.6 pC RMS 11.25 pC off-center mean due to slow component of the signal
total charge error estimation 2 pedestal RMS (1bunch) / total charge x 6 bunch • Si • 172.6 pC / 764.8 nC x √6 = 0.055 % RMS • IC • 11.25 pC / 19.8 nC x √6 = 0.139 % RMS
Uji electron beam test • 6-coil CT • Electronics calibration factor inc. AMP: (4.053±0.004) x 10–3 pC/ADC • Pedestal RMS: 17.9 (for 120 samples) 0.007 pC uncertainty • IC • Electronics calibration factor: (4.158±0.002) x 10–2 pC/ADC
Energy loss comparison (Uji/T2K) • Energy loss in the chamber (Ar + 2% N2, 131 kPa, 34˚C) by MC • Uji 100-MeV electron beam: 4.042 keV/electron (av. of all particles; g, e) • T2K beam at the center: 4.755/4.824/4.443 keV/muon (1st horn 0/220/273 kA) 4.674 ± 0.231 keV/muon (av. of all particles; g, e, m) T2K beam Uji beam
A-1. Chamber calibration • CT gain was calibrated by Suzuki-san • 0.1555 ± 0.0001 (out/input charge) • IC/CT from the Uji electron beam test • Correction of energy loss diff. between the electron beam and the T2K muon beam (16%). IC calibration factor: (4.80±0.25) x 103 muon/cm2/pC IC/CT = 128.0±0.2
A-2. Silicon calibration • Si/IC ratio from high intensity beam data (horn off) --- 33.89±0.09 • Correction of the z-position difference (8%) • Beam density at each position is different due to beam divergence. Silicon calibration factor: 154±9muon/cm2/pC
Absolute muon flux (chamber) • CT efficiency by calibration: 0.1555 ± 0.0001 CT factor: (4.019±0.003) x 107 particle/pC • IC/CT (Uji): 128.0±0.2 (Ar + 2% N2, 130 kPa, 29.7˚C) Uji IC factor: (3.140±0.006) x 105 electron/pC (3.120±0.006) x 105 electron/pC @ 131 kPa, 34˚C • Energy loss in MC (Ar + 2% N2, 131 kPa, 34˚C) • Uji 100-MeV electron beam: 4.042 keV/electron (av. of all particles; g, e) • T2K beam at the center: 4.674±0.231 keV/muon (av. of all particles; g, e, m) T2K IC factor (“collected charge” to “muon flux” conversion): (2.70±0.14) x 105 muon/pC = (4.80±0.25) x 103 muon/cm2/pC
Absolute muon flux (silicon - Si/IC) • T2K IC factor: (4.80±0.25) x 103 muon/cm2/pC • Charge ratio at the center Si/IC in data (run 280086, horn 0 kA): 33.89±0.09(–15 dB Att. is not calibrated, assuming 0.1777) • Beam size: sx,ySi 128.8±0.1, 138.1±0.1, sx,yIC 133.6±0.6, 155.4±0.4 cm • Muon flux ratio at the center of Si/IC plane in MC • 1st horn 0 kA: 1.066±0.017sta(sx,ySi 170±4, 166±4, sx,yIC 174±5, 177±5 cm) • 1st horn 220 kA: 1.072±0.015sta(sx,ySi 157±3, 162±3, sx,yIC 161±3, 182±5 cm) • 1st horn 273 kA: 1.084±0.013sta(sx,ySi 128±2, 125±2, sx,yIC 133±2, 139±2 cm) 1.084±0.018±0.013sta Si factor: 4.80 x 10³ / (33.89 / 1.084) = 154±9muon/cm2/pC
Absolute muon flux (silicon - dE/dx) • MC estimation of energy deposit in the silicon plane at the center with 1st horn 273 kA: Eloss = 2.420 GeV/(15266 muon) = 158.5 keV/muon • Ionization yield: Q = Eloss / 3.6 eV x e0 = 7.045 x 10⁻³ pC/muon Si factor: 141.9 muon/pC
Comparison between Si and emulsion • Muon flux ratio at the center of Si/emulsion plane in MC • 1st horn 0 kA: 1.096±0.018sta(sx,ySi 170±4, 166±4, sx,yIC 177±5, 183±5 cm) • 1st horn 220 kA: 1.113±0.016sta(sx,ySi 157±3, 162±3, sx,yIC 165±4, 188±5 cm) • 1st horn 273 kA: 1.128±0.014sta(sx,ySi 128±2, 125±2, sx,yIC 136±2, 145±2 cm) 1.128±0.032±0.014sta • Muon reduction rate at Si by the cut for the emulsion analysis (momentum > 0.05 GeV/c, angle < 0.3 rad) by MC • 1st horn 0 kA: momentum cut 0.024%, angle cut 2.1% • 1st horn 220 kA: momentum cut 0.026%, angle cut 3.4% • 1st horn 273 kA: momentum cut 0.052%, angle cut 3.6±1.2sta % 3.65±1.5±1.2sta %
Absolute flux (summary table) Muon flux measured by each detector at the center emulsion (104/cm2) Muon flux ratio of each detector to MC
Absolute muon beam flux Muon flux measured by each detector at the center emulsion (104/cm2) • Correction of the z-position diff. is applied. • Cuts for emulsion analysis is applied (p > 0.05 GeV/c, q < 0.3 rad) [ 3 horns 320 kA ] IC data/MC: 0.87 @ 3.7 x 10¹¹ ppb Silicon (chamber) measurement is consistent w/ emulsion one.