Download
1 / 44
480 likes | 649 Views
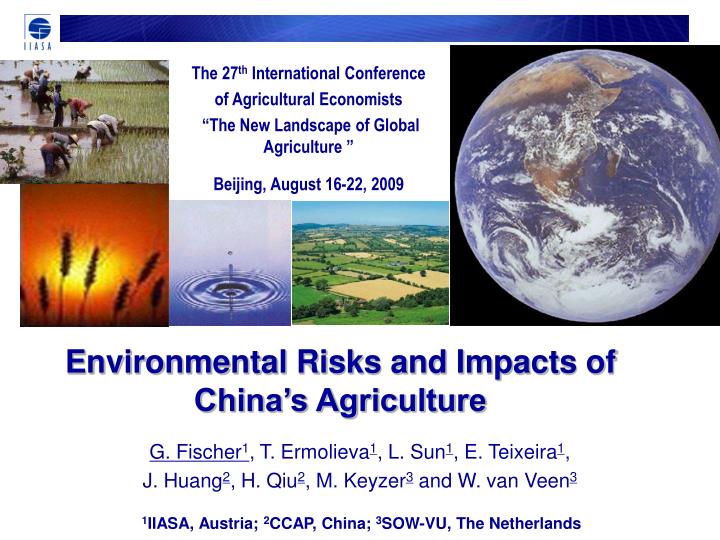
The 27 th International Conference of Agricultural Economists “The New Landscape of Global Agriculture ” Beijing, August 16-22, 2009. Environmental Risks and Impacts of China’s Agriculture. G. Fischer 1 , T. Ermolieva 1 , L. Sun 1 , E. Teixeira 1 ,

E N D
The 27th International Conference of Agricultural Economists “The New Landscape of Global Agriculture ” Beijing, August 16-22, 2009 Environmental Risks and Impacts of China’s Agriculture G. Fischer1, T. Ermolieva1, L. Sun1, E. Teixeira1, J. Huang2, H. Qiu2, M. Keyzer3 and W. van Veen3 1IIASA, Austria; 2CCAP, China; 3SOW-VU, The Netherlands
Environment : Impacts and Feedbacks The fast growth of consumption in China, meat in particular, has triggered intensification and concentration of production, requiring additional irrigation and leading to increased emission of pollutants, interacting with climate change and other environmental stresses: • Water scarcity • Climate change • Non-point source pollution • GHG emissions • Ground-level ozone
◦C Temperature response to increasing CO2 concentrations (China) CO2 ppm % Correlations between temperature increase and precipitation change (China) ◦C
Temperature change vs CO2 concentration Precipitation change (%) vs Temperature change Plateau Region Northwest Region
Sensitivity of Agro-ecosystems toGlobal Environmental Change +/- • Global warming • Removal of cold temperature limitations • Longer growing season • Faster growing period • Exceedance of temperature thresholds • Increased crop water requirements • Increased incidence of pests and diseases • Changes in composition of atmosphere • Yield increases due to CO2 fertilization • Increased water-use-efficiency • Pollution (e.g. tropospheric ozone) • Alterations in precipitation patterns, soil moisture conditions, surface runoff • Increased occurrence of extreme weather events • Increased climate variability + +/- - -
Rain-fed Wheat HadCM3, IPCC A2, 2050s Reference, 1961-1990 Agronomically Attainable Yield
Irrigated Wheat HadCM3, IPCC A2, 2050s Reference, 1961-1990 Agronomically Attainable Yield
Percentage of cultivated land in grid cell; calibration to province data of year 2000
Climate Change Impacts on Rain-fed Wheat Production Potential of Cultivated Land Calculation based on (i) spatial grid of climate, soil terrain data and cultivated land areas and (ii) FAO/IIASA AEZ crop yield estimation method. With climate change (as projected by Hadley Centre GCM) the national potential for rain-fed wheat production is decreasing, with reductions both in yield and suitable extents most pronounced in southern regions.
China: Climate Change Impacts (% change) on Rain-fed Wheat Production Potential Land Assumes full adaptation to best-suited wheat type.
Rain-fed Grain Maize HadCM3, IPCC A2, 2050s Reference, 1961-1990 Agronomically Attainable Yield
Climate Change Impacts on Rain-fed Maize Production Potential of Cultivated Land Calculation based on (i) spatial grid of climate, soil terrain data and cultivated land areas and (ii) FAO/IIASA AEZ crop yield estimation method. With climate change (as projected by Hadley Centre GCM) the national potential for rain-fed maize production is increasing, mainly due to yield increases in Northeast, North and Northwest regions.
China: Climate Change Impacts (% change) on Rain-fed Grain Maize Production Potential Land Assumes full adaptation to best-suited maize type.
Temperature change vs CO2 concentration Precipitation change (%) vs Temperature change North Region Northeast Region
Share of Irrigated Production in China Total in 2000; (percent) Source: Model-based estimation using county statistics of year 2000
China: Climate Change Impacts (% change) on Indicators of Agricultural Water System Note: percent change relative to respective reference projection without climate change. Crop water requirements (CWR) calculated as crop-specific potential evapotranspiration (plus special allowance for paddy). • In year 2000: • 54 million ha irrigated out of total 128 million ha cultivated (~ 42 %) • Agriculture uses 427 billion m3 out of 630 billion m3 annual water withdrawals (~ 68%) • On average, annually about 790 mm water applied
China: Climate Change Impacts on average Crop Water Requirements in Irrigated Areas HadCM3, IPCC A2 Scenario Calculation based on (i) spatial grid of climate and irrigated land areas and (ii) FAO/IIASA AEZ crop soil water balance method. CSIRO, IPCC A2 Scenario With climate change the share of irrigation in total water requirements as well as the total amount of water to be supplemented by irrigation increases; magnitude dependent on scenario and climate model.
Message 1: • Climate change requires substantial adaptation of cropping systems in China’s regions; • Crop production potential is shifting northwards with climate change; • Positive temperature effects may be limited by soil moisture deficits; • Crop water requirements projected to increase >10 percent by 2050; a growing fraction to be supplied by irrigation; • High risk that water stress will increase with climate change. Magnitude of effects varies with GCM and emission scenario.
Ground-level ozone Air pollutant: • Toxic to humans • Toxic to plants • Greenhouse gas Photochemical formation depends on: • Emission of precursors (e.g. NOx, VOCs) • Weather (e.g. radiation, temperature, wind)
Background • 21,400 premature deaths/year in EU are O3-associated • Crop losses in 2000: US$ 6.7 billion/year in EU and 14-26 billion global • Northern hemisphere [O3] > 2x pre-industrial revolution • Northern hemisphere background ~35-40 ppb; Peaks > 100 ppb in metropolitan areas • WHO guidelines: 50 ppb; Plant damage: 40 ppb • O3-precursor emissions were reduced in US, EU, Japan • Transboundary transport (global problem) • Climate change may exacerbate [O3] formation
Assessing O3 impact on crops with the AEZ methodology Seasonal ozone concentration TM5-JRC/Ispra Projections + APD-IIASA Emission Scenarios
[O3] Threshold Methodology 1) AEZ determines (i) crop type, (ii) crop calendar and the (iii) sensitive period 2) AOT40 index is calculated from TM5 daily projections Ozone load 3) AEZ estimates crop yields and the loss expected due to O3 exposure
WHEAT RICE SOYBEAN MAIZE
China Estimates of yield loss Assumptions: • TM5 runs with • IIASA CLE emissions scenario • AOT40 index • Rain-fed and irrigated systems independent Teixeira et al., (2008, forthcoming)
Royal Society Science Policy Report, October 2008: Figure: Global and regionally aggregated relative yield losses in 2000 for rice, wheat, maize and soybean (van Dingeren et al. in press). The bars indicate average values using two different exposure indices (AOT40 and either M7 or M12) while the error bars give the range of values using the two indices.
Message 2: • Ground-level ozone is estimated to have a substantial impact on China’s crop production; • Wheat and soybean are much more affected than rice and maize; • There are only very limited agronomic adaptation options to ground-level ozone; • Avoiding precursors of ground-level ozone formation is the most effective mitigation measure.
Emissions and Pollution Concern: A major concern about changes in the structure of China’s agricultural economy is the potential rise in the use of farm chemicals and their effect on water and ecology away from the place that the inputs are being applied: • Estimate plausible ranges of nutrient loads from fertilizer application and livestock production. • Define and compile spatially explicit risk proxies to indicate major environmental and human health hazards related to crop and livestock intensification. • Identify coincidence of driving forces that may cause production intensification and environmental loads in excess of environmental buffering/absorption capacity and health constraints.
Intensification of agricultural production • Economic growth: 6% average annual national GDP growth rate over the period 2000 - 2030 • Population increase: from 1263 mill in 2000 to about 1400 mill in 2030 • Urbanization increase: from 36% in 2000 to about 60% in 2030 • Land conversion: Cultivated and orchard land decrease is nearly 10 percent: from 138.4 Mha in 2000 to 127 Mha in 2030 • Risk perspective suggests rationale for spatial diversification and planning based on sustainability principles, using risk indicators.
Fertilizer consumption (kg nitrogen/ha cultivated land) 2000 2030 Confined livestock (kg biomass/ha cultivated land) 2030 2000
Nutrient balance calculation • County-specific supply/demand balances compare nutrients from livestock manure and chemical fertilizers with the requirements and uptake capacity of planted crops. Total nutrients losses include: • nutrient losses from livestock housing, from manure storage facilities, liquid manure, • losses of non-effective manure and fertilizer use, • losses due to over-supply of nutrients from fertilizers and manure to crops • manure nutrients produced by pastoral livestock systems
Intensity of nitrogen ‘surplus’(kg nutrients/ha total land) 2000 2030
Environmental pressure indexes:Nitrogen leaching, N2O / NH3 emissions, (kt) Challenge: Major uncertainties are associated with emission factors Need for robust solutions
Impacts of nitrogen ‘surplus’ • Nutrients are wasted higher economic costs and environmental impacts of production. • Nitrate in ground water used as drinking water has toxic impact on humans. Nitrate is converted into nitrite, which has high acute toxicity and is supposed to be carcinogenic. • When ground water becomes surface water, nitrate contributes to eutrophication. • Induces emissions of nitrous oxide, a major greenhouse gas ( climate change).
Measures to reduce ammonia emissions • Low-nitrogen feed assumes that the nitrogen content decreases. • Techniques to clean the air in animal housing. Ammonia is absorbed from the air and converted into nitrite and nitrate. During this process nitrous oxide emissions may occur. • Livestock housing adaptations imply a quick removal of the manure from the stable floor to a closed storage system. Manure from pigs and poultry is aerated and dried after removal from the animal house. • Manure application with low ammonia emissions (injection techniques). This reduces ammonia emissions during application (up to 80%) and but increases nitrous oxide emissions from agricultural soils. • Substituting urea fertilizers with ammonium nitrate reduces ammonia emissions from synthetic fertilizer use, without effecting nitrous oxide and methane emissions. • Covering outdoor storage of manure prevents the escape of ammonia during storage. May result in a decrease in nitrous oxide emissions and an increase in methane emissions.
Message 3: • Economic/demographic drivers will further increase the demand for agricultural products in China. Expansion is constrained by limited land resources. As a consequence, an increase of environmental impacts is to be expected; • Comparison across scenarios shows that “sustainable reallocation” achieves only little reduction of the overall nitrogenlosses. Its advantage over business-as-usual is in terms of reallocation of risks away from population centers. • The optimized fertilizers application scenario will lead to a no-regret situation. A significant fraction of chemical fertilizers can be saved by improved utilization of manure; • Benefits of the scenarios need to be compared not only in terms of achieved emission reductions but also in terms of such indicators as distribution of population within different emission loss classes.