Download
1 / 16
160 likes | 165 Views
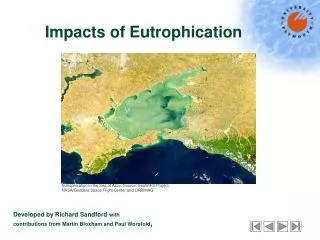
Overview of Eutrophication Indicators. SAB Lake Erie Phosphorus Objectives Review Meeting December 10, 2014. Charge to the SAB re: indicators.

E N D
Overview of Eutrophication Indicators SAB Lake Erie Phosphorus Objectives Review Meeting December 10, 2014
Charge to the SAB re: indicators 1. Please comment on whether the eutrophication response indicators proposed sufficiently address and provide the scientific foundation for the Lake Ecosystem Objectives for Lake Erie. During your evaluation of the eutrophication response indicators, identify other metrics appropriate for measuring eutrophication response in Lake Erie and other Great Lakes that should be considered, and whether there is a method (model) available to measure this response. Invited Technical Expert Presentations: SAB Lake Erie Phosphorus Objectives Review
Primer on Lake Erie - 1 A large, mostly shallow great lake showing a strong west to east gradient in depth and trophic status. Invited Technical Expert Presentations: SAB Lake Erie Phosphorus Objectives Review
Primer on Lake Erie - 2 The western basin is shallow, unstratified and eutrophic. It is subject to blooms of toxic cyanobacteria (cHABS). The central basin is deeper and mesotrophic. It stratifies with a thin hypolimnion that is prone to hypoxia. The eastern basin is deepest and oligotrophic, but its rocky littoral area is prone to fouling by Cladophora. Invited Technical Expert Presentations: SAB Lake Erie Phosphorus Objectives Review
Primer on Lake Erie - 3 Lake Erie in the 60’s and 70’s was infamous for its poor water quality, particularly for hypoxia in the Central basin; a “dead lake”. Water quality improved in response to reductions in point loads during the 80’s. Dreissenid mussels arrived at the end of the decade. The improving trend reversed during the 1990’s, and algal blooms, hypoxia and nearshore fouling are all current problems. Invited Technical Expert Presentations: SAB Lake Erie Phosphorus Objectives Review
Indicator # 1 Overall phytoplankton biomass as represented by chlorophyll a. Basin-specific, summer (June-August) average chlorophyll concentration. This is a traditional indicator of lake trophic status (i.e., oligotrophic, mesotrophic, eutrophic). Strengths: Availability of historical data. **** Indicator of water quality, trophic status. *** Indicator of phytoplankton biomass and production ** Can be measured by remote sensing *** Weaknesses: Does not provide information on community composition, toxicity. Invited Technical Expert Presentations: SAB Lake Erie Phosphorus Objectives Review
Indicator # 1 (chlor a) continued 2011 Depew 2006 Fitzpatrick 2006 2014 INDICATOR OF ALGAL BIOMASS, PRIMARY PRODUCTION, TRANSPARENCY Invited Technical Expert Presentations: SAB Lake Erie Phosphorus Objectives Review
Indicator # 2 Cyanobacterial blooms Cyanobacteria blooms (including Microcystis spp.) in the Western Basin. Maximum basin-wide cyanobacteria biomass (mass dry weight) Summer total basin-wide cyanobacteria biomass (mass dry weight integrated over summer bloom period) The first metric gives an indication of the worst condition relative to harmful algal blooms (HAB)s in the Western Basin, while the second factors in the cumulative effects of multiple drivers (loads, hydrology, wind, temperature, etc.) in producing a season-long cumulative production of HABs. The length of the “summer bloom period” referred to in this metric can vary from one scenario to another. Invited Technical Expert Presentations: SAB Lake Erie Phosphorus Objectives Review
Indicator # 2 Cyanbacterial blooms continued Strengths: Indicator of water quality ** Indicator of harmful algae ** Indicator of potential for toxicity *** Weakness: Includes non-harmful Cyanobacteria Only indicates a risk of toxicity Requires labour-intensive microscopic counts of phytoplankton, therefore fewer data. Invited Technical Expert Presentations: SAB lake Erie Phosphorus Objectives Review
Indicator # 4 Cladophora Cladophora in the nearshore areas of the Eastern Basin – Stored P Content While beach fouling by sloughed Cladophora is arguably the most important metric for nuisance algae, there is neither an acceptable monitoring program to measure and report progress, nor a scientifically credible model to relate it to nutrient loads and conditions. There are models that can relate Cladophora growth to ambient DRP concentration and models that can estimate nearshore DRP as a function of loads and biophysical dynamics. Linking these models could allow researchers and water quality managers to then relate loads to Cladophora growth, but the accumulation of errors across models minimizes the utility as a predictor. Instead, these models will explore the relative impacts of loads recommended for other eutrophication response indicators on Cladophora growth potential. DRP will be used as an input to the response curve model, and stored P content as the response measure of Cladophora biomass accumulation/growth. Invited Technical Expert Presentations: SAB Lake Erie Phosphorus Objectives Review
Indicator # 4, Cladophora Scott Higgins Photo
Indicator # 4 Cladophora cont’d Strengths: An important aspect of water quality not directly related to phytoplankton blooms or hypoxia. Cladophora growth models driven by TP and DRP are well-developed. Weaknesses: Cladophora is difficult and labour-intensive to sample. There are few data on Cladophora biomass for model verification and trend analysis. Near-bottom nutrient concentrations experienced by Cladophora may not be captured by water-column sampling. Invited Technical Expert Presentations: SAB lake Erie Phosphorus Objectives Review
Indicator # 3 Hypoxia Hypoxia in hypolimnion of the Central Basin – Number of hypoxic days Average areal extent during summer Average hypolimnion DO concentration during stratified lake conditions All three of these metrics are quantitatively correlated based on Central Basin monitoring and analysis, but they are different manifestations of the problem. Each has a bearing on the assessment of the impact on the ecosystem (especially fish communities), and on the relative impact of physical conditions and nutrient-algal growth conditions on the indicator. Invited Technical Expert Presentations: SAB Lake Erie Phosphorus Objectives Review
Invited Technical Expert Presentations: SAB lake Erie Phosphorus Objectives Review
Oxygen Depletion Processes: • Algae produce organic matter– affected by weather, grazing, sedimentation, time of year, distribution and concentration of nutrients • Some organic matter produced by algae falls into the hypolimnion where it decomposes in the water and in the sediment – decomposition consumes oxygen resulting in Oxygen depletion • affected by temperature, hypolimnion thickness, horizontal and vertical mixing, diffusion, • Systemic annual physical factors: – stratification date and temperature, end of stratification date, water level during stratified season, hypolimnion thickness, nutrient load • Variability in the factors affecting oxygen depletion generate a wide range of possible outcomes for any one year so that even with large nutrient reductions oxygen conditions similar to the present can be expected in some years. Invited Technical Expert Presentations: SAB lake Erie Phosphorus Objectives Review
Adequacy of the indicator suite. Looking to the future Fluorescence probes (fluoroprobe, PAM) can provide data on biomass, composition and production that formerly were labour-intensive to acquire. Microcystins and other toxins, toxin genes, can be measured. Information content of remotely-sensed data is increasing. Invited Technical Expert Presentations: SAB lake Erie Phosphorus Objectives Review