Download
1 / 22
220 likes | 347 Views
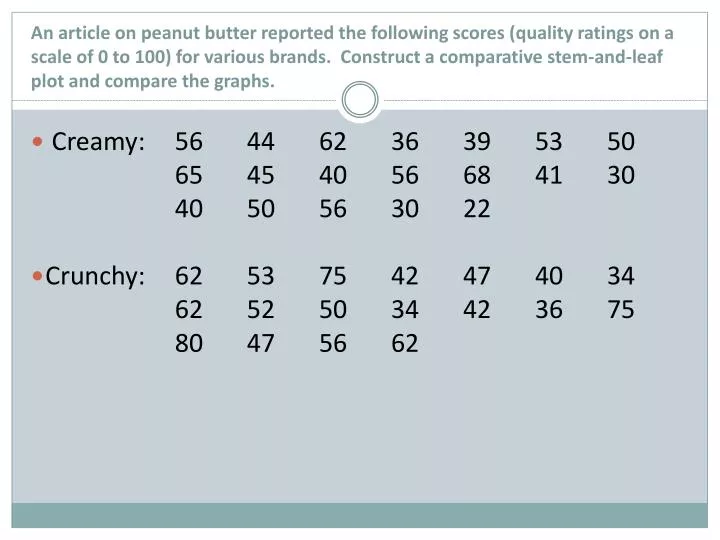
An article on peanut butter reported the following scores (quality ratings on a scale of 0 to 100) for various brands. Construct a comparative stem-and-leaf plot and compare the graphs. Creamy: 56 44 62 36 39 53 50 65 45 40 56 68 41 30 40 50 56 30 22

E N D
An article on peanut butter reported the following scores (quality ratings on a scale of 0 to 100) for various brands. Construct a comparative stem-and-leaf plot and compare the graphs. • Creamy: 56 44 62 36 39 53 50 65 45 40 56 68 41 30 40 50 56 30 22 • Crunchy: 62 53 75 42 47 40 34 62 52 50 34 42 36 75 80 47 56 62
Creamy: 56 44 62 36 39 53 50 65 45 40 56 68 41 30 40 50 56 30 22 Creamy: 56 44 62 36 39 53 50 65 45 40 56 68 41 30 40 50 56 30 22 • Crunchy: 62 53 75 42 47 40 34 62 52 50 34 42 36 75 80 47 56 62 Center:The center of the creamy is roughly 45 whereas the center for crunchy is higher at 51. Shape: Both are unimodal but crunchy is skewed to the right while creamy is more symmetric. Spread: The range for creamy and crunchy are equal at. There doesn’t seem to be any gaps in the distribution.
Standard Deviation • It’s a measure of the typical or average deviation (difference) from the mean.
Variance • This is the average of the squared distance from the mean.
Does the Average Help? • Paint A: Avg = 210/6 = 35 months • Paint B:Avg = 210/6 = 35 months • They both last 35 months before fading. No help in deciding which to buy.
Consider the Spread • Paint A:Spread = 60 – 10 = 50 months • Paint B:Spread = 45 – 25 = 20 months • Paint B has a smaller variancewhich means that it performs more consistently. Choose paint B.
Formula for Population Variance = Standard Deviation =
Formula for Sample Variance = Standard Deviation =
Formulas for Variance and St. Deviation Population Sample Variance Variance Standard Deviation Standard Deviation
Standard Deviation • A more powerful approach to determining how much individual data values vary. • This is a measure of the average distance of the observations from their mean. • Like the mean, the standard deviation is appropriate only for symmetric data! • The use of squared deviations makes the standard deviation even more sensitive than the mean to outliers!
Standard Deviation • One way to think about spread is to examine how far each data value is from the mean. • This difference is called a deviation. • We could just average the deviations, but the positive and negative differences always cancel each other out! So, the average deviation is always 0 not very helpful!
Finding Variance • To keep them from canceling out, we squareeach deviation. • Squaring always gives a positive value, so the sum will not be zero! • Squaring also emphasizes larger differences – a feature that turns out to be good and bad. • When we add up these squared deviations and find their average (almost), we call the result the variance.
Finding Standard Deviation • This is the average of the squareddistance from the mean. • Variance will play an important role later – but it has a problem as a measure of spread. • Whatever the units of the original data are, the variance is in squared units – we want measures of spread to have the same units as the data, so to get back to the original units, we take the square root of . • The result is, s, is the standard deviation.
Let’s look at the data again on the number of pets owned by a group of 9 children. Recall that the mean was 5 pets. Let’s take a graphical look at the “deviations” from the mean:
Let’s Find the Standard Deviation and Variance of the Data Set of Pets 1 – 5 = -4 3 – 5 = -2 4 – 5 = -1 4 – 5 = -1 4 – 5 = -1 5 – 5 = 0 7 – 5 = 2 8 – 5 = 3 9 – 5 = 4
Find Variance: This is the “average” squared deviation.
Find the Standard Deviation: This 2.55 is roughly the average distance of the values in the data set from the mean.
Homework • Worksheet