Download
1 / 36
360 likes | 468 Views
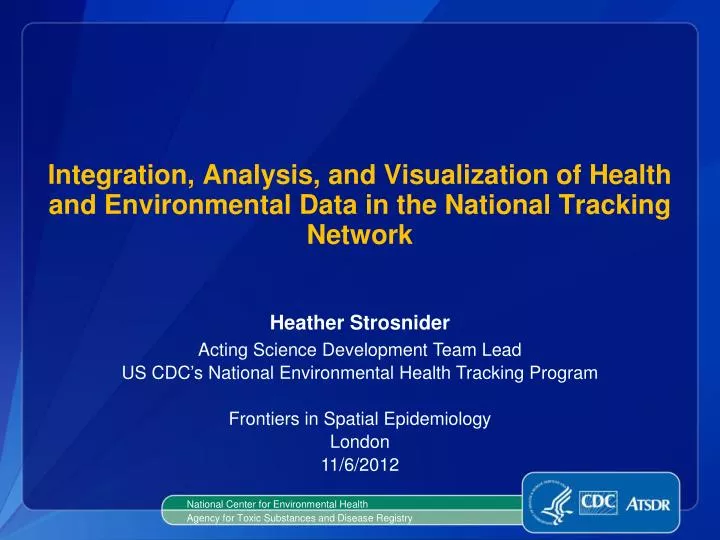
Integration, Analysis, and Visualization of Health and Environmental Data in the National Tracking Network. Heather Strosnider. Acting Science Development Team Lead US CDC’s National Environmental Health Tracking Program Frontiers in Spatial Epidemiology London 11/6/2012.

E N D
Integration, Analysis, and Visualization of Health and Environmental Data in the National Tracking Network Heather Strosnider Acting Science Development Team Lead US CDC’s National Environmental Health Tracking Program Frontiers in Spatial Epidemiology London 11/6/2012 National Center for Environmental Health Agency for Toxic Substances and Disease Registry
Recommended a “Nationwide Health Tracking Network for diseases and exposures” Pew Commission: Environmental Health Review, 2000 • Chronic conditions account for 4 out of every 5 deaths in the United States • Little information is routinely collected on non-infectious disease • Environmental monitoring conducted regulatory purposes • Little human exposure data • Answers needed about the role of the environment on health outcomes
Tracking Network:Integrated Data for Environmental Health • Detect and monitor trends • Generate hypotheses • Guide action • Inform policymaking • Provide information • Track progress
ACTION KNOWLEDGE INFORMATION DATA Tracking Program • National Network • Public Portals • Secure Portals • Standardized Data • Data Utilization • Engage Partners • Build Capacity
National Public Portal • 15 datasets • 2.2 GB of data • 18.7 million rows of data • 257 measures
Content and Data • Biomonitoring • Climate Change • Community Design • Homes • Outdoor Air • Population Characteristics • Water • Asthma • Birth Defects • Cancer • CO Poisoning • Childhood Lead • Developmental Disabilities • Heart Attacks • Reproductive Birth Outcomes
Criteria for Prioritization • Burden - Magnitude and severity • Information system factors • Resonates with partners • Scientific plausibility • Ability to take action • Direction from Congress
T3 Tables CMS T4 Tables SQL SQL SQL Middleware Spring JAVA Blaze DS Hibernate Portal Flex Anychart ESRI Flex Map
Percent of children tested with confirmed elevated blood lead levels, by birth cohort
Average annual number of Cleft Lip with or without Cleft Palate among live births Number of states providing birth defect data
Percent of children, 3-17, receiving early intervention, special education, or related services for developmental disability
Estimated percent change in death rate from baseline associated with 20% reduction in air pollution HIA
Integrated messaging with data • Added new base layers to maps • Improved export by adding supporting info
(Required) Heat Metric Definition Percentile Max Daily Temperature Fahrenheit Max Daily Heat Index Threshold: Absolute or Relative Percentile Minimum Duration 2 or more days 3 or more days Climate Change Extreme Heat Days and Events Number of extreme heat events
Under Evaluation for the Public Portal • Air toxics • Ischemic heart disease mortality benefits associated w/ reducing PM2.5 • Mortality associated with extreme heat events • Addt’l cardio and resp hospitalizations, ED visits, & mortality • Temporal & spatial patterns in pollen • Radon in homes • Private well water • Occupational health • ALS (from ATSDR registry) • Vulnerability measures • Pesticide residue in food • New modeled air • Intellectual disabilities from ADDM • BLL 5 to <10 • USGS soil • Precipitation • PM speciation and source
Future Functionality • Improved metadata • Enhanced charting options • View benchmarks • Exploring • Animated time map • Ability to compare related measures • Ability to compare populations
Percent low birthweight Percent smoke 2002-2006 2002 Percent living in poverty Percent uninsured 2002 2002
Addressing Gaps in Data, Methods & Information • Evaluating national, state, and local data systems • Inventory of available data and quality • Recommendations for reaching national consistency • Evaluating and developing methods • Environmental epidemiology • Exposure assessment • Linking health and environmental data • Tracking environmental health • Picture of America report • Surveillance summaries • Impact of exposure • Evaluation of policies and programs
Addressing Gaps in Data, Methods & Information • Evaluating methods for defining extreme heat events • Linking PM2.5 with cleft birth defects and reproductive birth outcomes • Estimating IHD benefits associated with reductions in PM2.5 • Evaluating and developing models for estimating air pollution
Tracking in Action • 200+ skilled EPH practitioners in 23 states and NYC • 18 ASTHO fellowships since 2008 • 133 publications and health reports since 2002 • 132 public health actions since 2005 http://www.cdc.gov/nceh/tracking/successstories.htm
Reducing Effects of Extreme Heat in California • Cooling centers costly, but can be life-saving • San Jose city leaders needed proof of health impacts of heat before approving cooling centers • Tracking identified increase of heat-related ER visits during heat events • City leaders approved cooling centers to open
Reducing Asthma Hospital Stays in New York City • Increase in childhood asthma hospital stays and ED visits • Data used to urge update of asthma management plans for school start • Decreasing rates of asthma hospital stays • Advisories now standard practice
Reducing Arsenic Exposure in Oregon • Known elevated levels of arsenic in private wells • Oregon does not require water to be tested for arsenic • Using data on arsenic levels in drinking water • Educated community by explaining results and encouraged water testing • Prompted state legislation to add arsenic to list of substances to test in private wells
Improving Water Quality Datain Wisconsin • Tracking Program enhanced community drinking water data by identifying water sources and connecting population to their water system • Data used to identify and prioritize water sourcesthat are likely to be contaminatedand areas of greatest risk
Addressing Childhood Lead Poisoning Risk in Missouri • Many children living in St. Louis have elevated blood lead levels • Tracking Program looked at relationship between building demolitions and BLLs of children living nearby • Children exposed to multiple demolitions showed a rise in BLLs • Demolition site work practices revised and inspections increased
Value • “The [Pew] Commission estimates that the annual cost for a Nationwide Health Tracking Network is $275 million.” • For ~ 10% of this investment – • National Network • Environmental health infrastructure in 23 states and NYC • Mentoring and resources for unfunded states • Increased responsiveness to community concerns • Resource to other PH programs • Opportunities to be proactive vs reactive • Informing policy changes • Improving our understanding of impact on health
External Program Review Grantees report that Tracking is one of the most significant and far-reaching national environmental health programs. • Programmatic and policy improvements directly • attributed to Tracking: • Data availability, quality, and specificity • Intra- and inter- agency collaboration between health and environmental programs • Data-driven prioritization of and interventions to address environmental public health problems.
Thank youHStrosnider@cdc.govephtracking.cdc.gov For more information please contact Agency for Toxic Substances and Disease Registry or the Centers for Disease Control and Prevention ATSDR: 4770 Buford Highway NE, Chamblee, GA 30341 Telephone: 1-800-CDC-INFO (232-4636)/TTY: 1-888-232-6348 E-mail: cdcinfo@cdc.gov Web: http://www.atsdr.cdc.gov CDC: 1600 Clifton Road NE, Atlanta, GA 30333 Telephone: 1-800-CDC-INFO (232-4636)/TTY: 1-888-232-6348 E-mail: cdcinfo@cdc.gov Web: http://www.cdc.gov The findings and conclusions in this report are those of the authors and do not necessarily represent the official position of the Centers for Disease Control and Prevention or the Agency for Toxic Substances and Disease Registry National Center for Environmental Health Agency for Toxic Substances and Disease Registry