Download
1 / 6
60 likes | 134 Views
Skill Sharing: How to pre-process and visualize data. GLEON Fellowship Workshop January 14-18, 2013 Sunapee, NH Aline Jaimes. Application to data. Use eddy covariance data from my research station in New Mexico. . Source: Jornada experimental range. Source: Missouri Botanical Garden.

E N D
Skill Sharing:How to pre-process and visualize data GLEON Fellowship Workshop January 14-18, 2013 Sunapee, NH AlineJaimes
Application to data • Use eddy covariance data from my research station in New Mexico. Source: Jornada experimental range Source: Missouri Botanical Garden
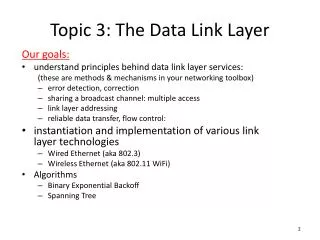
Application to data • Main challenges • To integrate 3 data tables sampled at different frequencies • 10Hz – flux data • 30min – meteorological data • 1min – soil data
This script is an example of how to pre-process and visualize data to assess data quality.
Skill relevance/usefulness • Assessing quality and status of data sets is a tedious but important work towards data integration. • Having a automated script to repeat the process will ensure consistency throughout the data set.
Data visualization • 2D and scatterplotColormaps Time-of-the-day DOY