Download
1 / 82
820 likes | 957 Views
Kentucky Continuous Monitoring Process. 2008. Here we Grow!. Some people think KCMP is a dirty job…. ACTIVITY Turning a Dirty Job into a Sweet Treat. We’ve been growing!. Some of our first steps … The KCMP has been data driven for 4 years. Data are more accurate. Data analysis is richer.

E N D
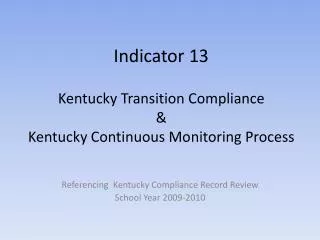
Kentucky Continuous Monitoring Process 2008 Here we Grow!
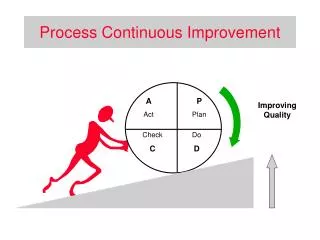
We’ve been growing! Some of our first steps … • The KCMP has been data driven for 4 years. • Data are more accurate. • Data analysis is richer. • Planning process is stronger. However….. There is always room for improvement…
Menu Click the section you would like to view. • Overview • KCMP Tools • Indicators
KCMP Overview • Emphasis on results • Focused • Continuous improvement • Multiple procedures • Data Driven Handout: KCMP Overview
Attributes • Continuity • Partnership with Stakeholders • Needs Assessment • Data-Driven Decision-Making Process • Priorities
***Activity*** Jigsaw With 2 other people, read and report on the process steps explained on pages 3 and 4 of the Overview. • Person A: Steps 1-3 • Person B: Steps 4-6 • Person C: Steps 7-9
Process Steps • Step 1: Create a District Review Team • Step 2: Collect and Review Data • Step 3: Analyze Data and Develop Improvement Plan • Step 4: Submit the Report • Step 5: Validate and Approve Plan • Step 6: Implement the Plan • Step 7: Review and Evaluate Plan • Step 8: Revise Plan • Step 9: Cycle Continues
KCMP Tools are available online! • The link to the KCMP webpage will be disseminated via email. • All KCMP documents will be available on the website. • Monitoring Documents with district-specific data will be emailed to DoSEs.
KCMP Tools Information Documents • KCMP Overview • KCMP Timelines 2007-2008 • Indicators at a Glance • Indicators at a Glance Side-by-Side • KCMP Data Collection List • Suggested Data Collection Schedule • Proposed District Review Team Meeting Schedule • Potential Resources • 2006-07 KCMP Power Point • 2006-07 KCMP Review Document
KCMP Tools Instructional Documents • Technical Instructions • Explanation of Disproportionality for FAPE 1.1 and FAPE 1.2 • Instructions for Completing Dropout Rate FAPE 2.2 • Instructions for Calculating Suspension Rate FAPE 3.1
KCMP Tools Sample Documents • Non-Academic Data Report • Kentucky Performance Report • December 1 Child Count • Secondary Transition Definitions and Examples
Parent Surveys Preschool School Age Teacher Surveys Preschool School Age Record Review Form Tally Sheets Survey Record Review KCMP Tools Data Collection Forms
Check your understanding of sampling! You have: • 242 records • 72 records • 5 records • 1,223 records You must review at least: • 24 records • 10 records • 5 records • 50 records KCMP 1 - Record Review (10% of records or a minimum of 10 records, maximum of 50) Click here to skip this slide.
Changes • No more CD! • One document instead of two! • Enhanced Transition section • Added FAPE 5.2 • FAPE 6.1 has changed • Submission through KDE website
2006-07 Monitoring Document Handout: Technical Instructions
EC 1.1 KCMP Monitoring DocumentRecord Review
Learn how to calculate disproportionality Click here Continue with FAPE 1.1 Click here
Disproportionality Calculations Kaysimp County Sample
What is the “risk” of being identified as disabled in Kaysimp County if you are not African-American? • There are 1000 students in Kaysimp County who are not African-American. • There are 100 students in Kaysimp County who are not African-American but are disabled. Calculate the “risk” by dividing the total non- African-American students by disabled non- African-American students.
10% The “risk” of being identified as disabled in Kaysimp County if you are not African-American is…
What is the “risk” of being identified as disabled in Kaysimp County if you are African-American? • There are 10 African-American students in Kaysimp County. • There are 2 African-American students in Kaysimp County who are disabled. Calculate the “risk” by dividing the total African-American students by disabled African-American students.
20% The “risk” of being identified as disabled in Kaysimp County if you are African-American is…
What is Kaysimp County’s risk-ratio for African-American students being identified as disabled? • The “risk” for being identified if you are African-American is 20% • The “risk” for being identified if you are not African-American is 10%. To calculate the risk-ratio, divide the risk for being identified if you are African-American by the risk for being identified if you are not African-American.
2.0 The risk-ratio for African-American students identified as disabled in Kaysimp County is…
Bonus Questions!! • How many students are there all together in Kaysimp County? 1010 (1000 students who are not African-American and 10 students who are African-American.) • How many disabled students are there in Kaysimp County? 102 (100 students who are not African-American and 2 students who are African-American.)
FAPE 2.2 Instructions for Completing Drop Out Rate FAPE 2.2
FAPE 3.1 Instructions for Completing Suspension Rate FAPE 3.1