Download
1 / 23
230 likes | 360 Views
Monitoring land use and land cover changes in oceanic and fragmented lanscapes with reconstructed MODIS time series R. Lecerf, T. Corpetti, L. Hubert-Moy and V. Dubreuil COSTEL UMR CNRS 6554 LETG Multitemp-2005, 16-18 May 2005 Biloxi, Mississippi USA. COSTEL. INTRODUCTION. Focus:

E N D
Monitoring land use and land cover changes in oceanic and fragmented lanscapes with reconstructed MODIS time series R.Lecerf, T. Corpetti, L. Hubert-Moy and V. Dubreuil COSTEL UMR CNRS 6554 LETG Multitemp-2005, 16-18 May 2005Biloxi, Mississippi USA COSTEL
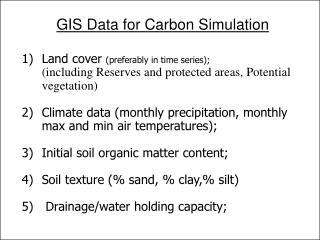
INTRODUCTION Focus: Winter bare soils increase losses of nutrients, pesticides or soils from agricultural fields and damage water quality. Monitoring winter bare soils at meso-scale with medium resolution image time series such as MODIS in farming areas located in fragmented landscapes. Time series extracted from original images are often corrupted and hence not exploitable (atmospheric and geometric distortions and others artifacts) Objective : Reconstruction of high accurate NASA EOS/MODIS time series based on selected and preprocessed daily images. Experiment of twofold cost function using Robust estimators
INTRODUCTION • Data : NASA EOS/MODIS time series • High resolution images low revisit frequencies and small coverage • Coarse resolution (1km) images spatial resolution too large to study fragmented landscapes • Medium resolution images spatial resolution more adapted to fragmented landscapes and high revisit frequency • - 16 days NDVI composite (MOD13Q1) - Daily surface reflectance images pre-processed by NASA (MOD09GQK) - Daily Level 1B images corrected by us (MOD02QKM) • The study area : Britanny • - an intensive farming region • - highly fragmented landscape • - 350 km x 150 km large • - oceanic climate with frequent winter cloud cover
SUMMARY • DATA AND PRE-PROCESSING STEPS • ROBUST SMOOTHING TEMPORAL DATA • RESULTS OBTAINED FROM SINGLE DATE DATA SETS • RESULTS OBTAINED FROM TIME SERIES DATA SETS • CONCLUSION
DATA AND PREPROCESSING STEPS MODIS 16 days NDVI synthesis (MOD13Q1) MODIS 16 days NDVI synthesis at 250m (Constraint View – Maximum Value Composite) Are used to calculate monthly NDVI by three steps: 1. Masking of residual clouds with QA bands 2. Selection of NDVI maximum values 3. Selection of minimum viewing zenithal angles The MOD13Q1 product which is the nearest of the considered month is selected Images are projected into a french coordinate system Monthly composites CV-MVC
DATA AND PREPROCESSING STEPS MODIS daily images selection • MODIS daily surface reflectance images at 250m [MOD09GQK] • MODIS daily level 1B products [MOD02 also called MODIS L1B] • - Daily images are often completely cloudy • - High viewing zenithal angles are degrading edges, reflectance values. • MODIS daily images are selected based upon two criteria : • less than 50% cloud cover • within a radius of 200km centered on Brittany • Through the Eos Data Gateway: • Cloud cover is given for each MODIS tile and not only for a subsetted area. • Viewing zenithal angles are not available for a precise location.
DATA AND PREPROCESSING STEPS MODIS daily images pre-processing • MOD09GQK MODIS daily data atmospherically and geometrically preprocessed by NASA (Daily surface reflectance images) • Atmospheric corrections are applied using PGE 11 algorithm: • Algorithm changed 11 times since the first image of the time series • Corrections depend on other MODIS products like cloud mask • Red and NIR bands at 250m are used to compute NDVI : • NDVI = (NIR-Red)/(NIR+Red)
DATA AND PREPROCESSING STEPS MODIS daily images pre-processing MOD02QKM Daily images without atmospheric and geometric corrections - Atmospheric corrections using MODIS land rapid response algorithm (crefl) - Computing of NDVI with MODIS land rapid response algorithm (ndvi_evi) - Geometric corrections using MODIS Swath Reprojection Tool (NASA EDCS) and geolocation file (MOD03). Note on atmospheric corrections: crefl algorithm is a 5S like model.
DATA AND PREPROCESSING STEPS High resolution images (SPOT, LANDSAT, ASTER) High resolution images used for validation of MODIS time series: SPOT/HRVIR LANDSAT/ETM ASTER All images are atmospherically and geometrically corrected Atmospheric corrections using 5S for SPOT and LANDSAT Red and Near infrared bands are aggregated using mean values to get NDVI values for cells of 250m.
Conclusion on daily MODIS time series • Daily image time series are not homogeneous: • Revisit frequency is not regular • Data are still corrupted by clouds, cloud shadows, aerosol, angles variations… Yellow cases: Images selected for year 2003
Robust smoothing temporal data: General reconstruction formulation Reconstruction of time series using a twofold cost function: Reconstructed time series = y(t) Observed time series = x(t) Favors smooth solutions: Solutionwith the lowest temporal derivative α orders the influence of the smoothing function
Robust smoothing temporal data: General reconstruction formulation • Function not adapted to high outliers data : • Clouds • Cloud shadows • Detector errors • High variations are kept into the time series. Next step : integration of a robust function
Robust smoothing temporal data: Robust reconstruction formulation Robust estimator: Imposes different penalisations for coherent and incoherent data For high outliers: attenuates the contribution of the observed values
Robust smoothing temporal data: Robust reconstruction formulation With a quadratic function, resulting time series depend on high outliers With a robust estimator the weight of high outliers is minimal and particularly with a Geman/Mc Clure M-estimator
Robust smoothing temporal data: Robust reconstruction formulation This function is not convex and leads to minimization difficulties We can cope with this problem by using semi-quadratic functions
Results FROM SINGLE DATE DATA SETS Comparison of MODIS images with a Landsat ETM image, March 2003 Monthly composite (MOD13Q1) r = 0.64 Landsat ETM Daily image (MOD09GQK) r = 0.70 NDVI Reference images Daily image (MOD02QKM) r = 0.86
Results FROM SINGLE DATE DATA SETS Daily images pre-processed with MODIS land rapid response algorithm show better accuracy than MODIS surface reflectance products. Similar results are obtained with SPOT/HRVIR and ASTER images Then, NDVI time series have been reconstructed using these products
Results FROM SINGLE DATE DATA SETS Before reconstruction After reconstruction r = 0.77 r = 0.86 March 2003 December2003 NDVI Reconstructed images are more reliable than surface reflectance images (MOD09GQK) distributed through the EOS Data Gateway
Results FROM TIME SERIES DATA SETS 1- Meadows 2-Corn 3- Wheat 4- Forest
Experimental results: FROM TIME SERIES DATA SETS • Based on ground truth and meteorological data, NDVI profiles depend on: • land cover types • mixture of land cover types • precipitations and temperatures
Experimental results: FROM TIME SERIES DATA SETS Corn Winter Wheat NDVI profiles are coherent with canopy development and crop phenology : - Corn begins to grow up in may and is senescent in September - Winter wheat begins to grow up in February/March and is harvested in July
Conclusion MODIS daily images are more reliable than monthly composites to determine bare soils in winter in fragmented landscapes. Daily images pre-processed with MODIS land rapid response algorithm show better accuracy than MODIS surface reflectance products. The use of a robust estimator to reconstruct NDVI time series appears to be useful to minimize contribution of high outliers. The smoothed NDVI time series obtained are suitable to monitor vegetation phenology in fragmented landscapes.
Acknowledgments Thanks to Jacques Descloitres (MODIS Land Rapid Response) to provide us the atmospheric correction algorithm