Download
1 / 21
210 likes | 316 Views
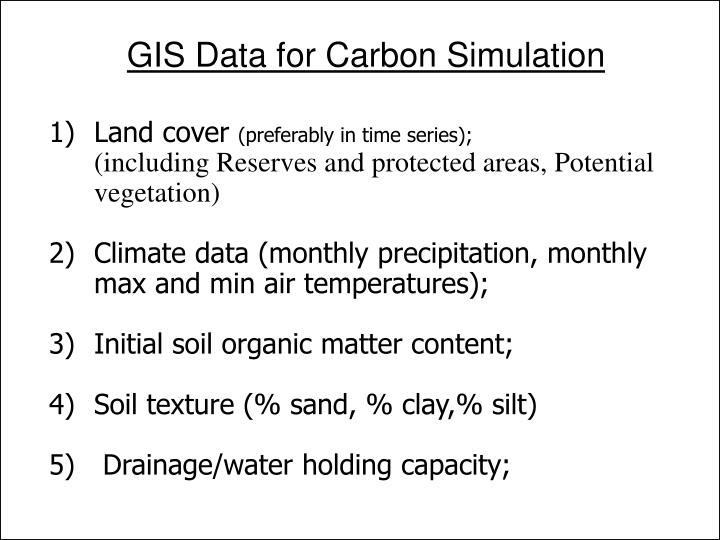
GIS Data for Carbon Simulation. Land cover (preferably in time series); (including Reserves and protected areas, Potential vegetation) Climate data (monthly precipitation, monthly max and min air temperatures); Initial soil organic matter content; Soil texture (% sand, % clay,% silt)

E N D
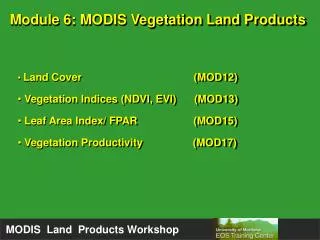
GIS Data for Carbon Simulation • Land cover (preferably in time series); (including Reserves and protected areas, Potential vegetation) • Climate data (monthly precipitation, monthly max and min air temperatures); • Initial soil organic matter content; • Soil texture (% sand, % clay,% silt) • Drainage/water holding capacity;
GIS or Tabular Data for Carbon Simulation • Crop yield or net primary productivity; • Land use (fertilization, cultivation, tree or crop species; Rotation probability; Harvesting practices, Fertilization; Irrigation; Grazing; Organic matter addition, Land fire; Cultivation....); times of inputs and occurrences • C:N ratios of plant tissues and SOC pools; • Soil erosion and deposition.
Objectives • Adapt GEMS (general ensemble biogeochemical modeling system) for Africa • Quantify carbon dynamics in the Department of Velingara from 1900 to 2100 • Assess the impacts of land use and climate change on carbon dynamics • Discuss carbon management options
Cover Biomass SOC (0-40 cm) SOC (0 – 20 cm) Bulk Mean Range Mean Range Mean Range Den. Cropland 1.9 09-4.0 29.9 15.0-56.0 19.2 9.6-35.9 1.57 Fallow 29.9 6.2-49.5 22.2 20.2-25.5 14.2 12.9-16.3 1.58 Forest 53.3 19.1-134.0 41.3 25.8-57.4 26.5 16.5-36.7 1.52 Parkland 20.0 19.4-20.5 18.8 17.0-19.8 12.0 10.9-12.7 1.42 Savanna 26.1 14.7-43.1 37.7 29.7-50.1 24.2 19.0-32.1 1.57 Field Measurements of Carbon Stocks Data were collected around six villages in five land cover classes. Unit: MgC ha-1 SOC contents in the top 0 – 20 cm layer were estimated from those in the 0 – 40 cm layer according to Jobbagy and Jackson (2000).
Data Assimilation System Ecosystem Biogeochemical Model Input Files Output Files JFD Cover Databases Land Use Info Units Soils Climate JFD Table Land Cover Overlay Operation Time Spatial and Temporal Changes of Land Cover, Carbon Stock in Vegetation and Soils GIS Coverages • Spatially-Explicit Biogeochemical Modeling • The General Ensemble biogeochemical Modeling System (GEMS) is developed to simulate carbon dynamics over large areas. It consists of • Encapsulated ecosystem biogeochemical model(s). • Data assimilation system • Input/output processor • User-friendly GUI
Meaning of Each Column in the JFD Table Number of Simulations for Each Cohort, n JFD Grid/Table yes End of JFD Table? Stop Diagram of information flow linking the CENTURY model with GIS data to produce estimates of regional emissions in GEMS no Read a Cohort K = 0 Copy Default Input Files From Library Update Default Input Files Run CENTURY Write Output K = k + 1 no K>n? yes
Modeling Environment Specifications jfd_vlg.xtr JFD file var_order_vlg.xtr variable order in the JFD file /edcsnw64/data/sliu/velingara/edc100files default century 100 files status0.bin file name specifying the starting status of simulations; use NONE if no file 2 previous status based on potential vegetation types (=1), or JFD cases (=2) status1.bin file name specifying the ending status of simulations; use NONE if no file 0 spinning up run under potential vegetation (=1), otherwise (=0) 0 MONTE_CARLO (yes = 1; no=0) 5 Number of runs for each unique JFD case 2 Land cover choice (1 --- ag census data; 2 --- GIS grid Time Series; 3 --- both) 6 total number of LC datasets 9 max number of years that remote sensing can pick up clearcutting activities 1900 Init_landcov 1973 lc0 1978 lc1 1984 lc2 1990 lc3 1999 lc4 soil.data soil data base soil_dr_vlg.data soil drainage data prec_tab.txt monthly precipitation MinTemp.txt monthly min temperature maxTemp.txt monthly max temperature croprotat.data crop trasition probability generated from NRI n_depo.txt atmospheric deposition data base lc2cent.map land cover codes and default site file crop_comp.data crop composition data fallow.data fallow info manager.data data on fire, forest harvest, grazing etc.
Default site file Tree or crop species Rotation probability Harvesting practices Fertilization Irrigation Grazing Organic matter addition Land fire Cultivation Mapping Land Cover to CENTURY
Year Millet Sorghum Cotton Ground-nuts Maize Rice 1973 18.3 2.7 28.9 35.1 9.2 5.8 1978 26.2 8.8 16.1 25.4 12.0 11.4 1984 11.3 17.4 32.0 15.6 16.3 7.3 1990 9.5 21.6 14.7 15.9 27.2 11.1 1999 7.1 26.7 12.1 29.0 18.2 6.9 Crop Composition (%) and its Temporal Change
Year Land Cover Class 1973 1978 1984 1990 1999 Dense Savanna Woodland 30 29 26 25 21 Dry Deciduous Woodland 23 21 18 17 16 Dense Savanna Woodland with bowe 15 14 14 14 14 Extensive Ag land with some fallow (1-3 years) 9 11 8 9 13 Bushland, Old Fields 0 0 5 3 13 Intensive Ag land with few fallow (0-1 year) 6 8 14 17 8 Savanna Woodland 8 8 6 6 5 Moist semi-evergreen woodland, gallery forest 4 4 3 3 3 Riparian forest 3 3 3 3 2 Shrub Savanna 2 2 2 2 2 Land Cover Change
Joint Frequency Distribution Table Index Land Covers Climate Soil Frequency Reserve
Data Assimilation System Land Covers Climate Database Soil Database Reserved? Management Practices, etc. Weather file Site file Schedule file Etc. CENTURY input files
Grain Yield • It was assumed that agricultural will not expand in 21st century • High Climate Change Scenario (HCCS) poses a great threat to food security
Net Primary Productivity • NPP varies between 3 and 4 MgC/ha/y. • Large inter-annual variability caused by precipitation fluctuation. • NPP decreases under HCCS (i.e., large climate change)
Carbon in Live Biomass • C stock in undisturbed dry and moist tropical forest is 88 and 135 MgC/ha, respectively • C stock has decreased by 46% from 1900 to 2000 in Velingara • Woodfuel production has a larger impact than climate change
Soil Organic Carbon • SOC stock in undisturbed dry and moist tropical forest is 29 and 35 MgC/ha, respectively • SOC stock has decreased by 9% from 1900 to 2000 in Velingara • The max difference caused by management and climate change options is about 5 MgC/ha in 2100
Total C Stock in Vegetation and Soil • Total C stock has decreased 37% from 1900 to 2000 • Live biomass reduction accounts for 88% of the total C loss • Selective logging has a significant impact • Large climate change (HCCS) reduces C stock