Download
1 / 36
370 likes | 1.24k Views
Outline. Overview: Why Propensity Score Matching?Highlights of the key features of PSMExample: Does substance abuse treatment reduce the likelihood of child maltreatment re-report?. Why Propensity Score Matching?. Theory of CounterfactualsThe fact is that some people receive treatment.The counterfactual question is:

E N D
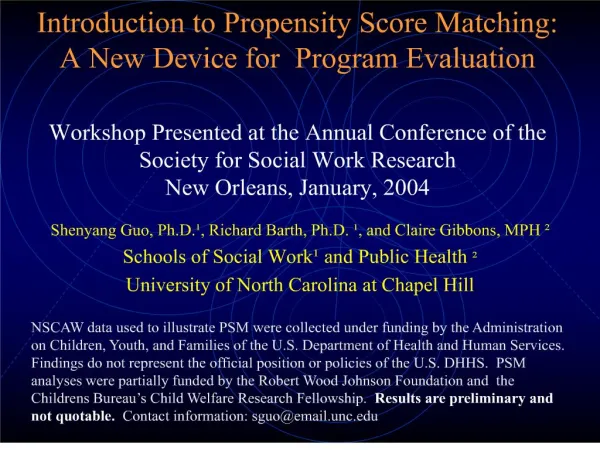
1. Introduction to Propensity Score Matching: A New Device for Program Evaluation Shenyang Guo, Ph.D.�, Richard Barth, Ph.D. �, and Claire Gibbons, MPH �
Schools of Social Work� and Public Health �
University of North Carolina at Chapel Hill
2. Outline Overview: Why Propensity Score Matching?
Highlights of the key features of PSM
Example: Does substance abuse treatment reduce the likelihood of child maltreatment re-report?
6. Limitations of Quasi-Experimental Designs Selection bias may be substantial
Comparison groups used to make counterfactual claims may have warped counters and failing factuals, leading to intolerably ambiguous findings
10. PSM Has Skeptics, Too Howard Bloom, MDRC
Sees PSM as a somewhat improved version of simple matching, but with many of the same limitations
Inclusion of propensity scores can help reduce large biases, but significant biases may remain
Local comparison groups are best�PSM is no miracle maker (it cannot match unmeasured contextual variables)
Short-term biases (2 years) are substantially less than medium term (3 to 5 year) biases�the value of comparison groups may deteriorate
Michael Sosin, University of Chicago
Strong assumption that untreated cases were not treated at random
Argues for using multiple methods and not relying on PSM
11. May want to note here that propensity scores only control for selection bias, but that we still need to worry about other limitations in our analysis (e.g., measurement error).May want to note here that propensity scores only control for selection bias, but that we still need to worry about other limitations in our analysis (e.g., measurement error).
13. Risks of PSM They may undermine the argument for experimental designs�an argument that is hard enough to make, now
They may be used to act �as if� a panel survey is an experimental design, overestimating the certainty of findings based on the PSM.
14. A Methodological Overview Reference list
The crucial difference of PSM from conventional matching: match subjects on one score rather than multiple variables:�� the propensity score is a monotone function of the discriminant score� (Rosenbaum & Rubin, 1984).
Continuum of complexity of matching algorithms
Computational software
STATA � PSMATCH2
SAS SUGI 214-26 �GREEDY� Macro
S-Plus with FORTRAN Routine for difference-in-differences (Petra Todd)
16. Nearest neighbor and caliper matching Nearest neighbor: Randomly order the participants and nonparticipants, then select the first participant and find the nonparticipant with closest propensity score.
Caliper: define a common-support region (e.g., .01 to .00001), and randomly select one nonparticipant that matches on the propensity score with the participant. SAS macro �GREEDY� does this.
17. Problem 1: Incomplete Matching or Inexact Matching? While trying to maximize exact matches (i.e., strictly �nearest� or narrow down the common-support region), cases may be excluded due to incomplete matching.
While trying to maximize cases (i.e., widen the region), inexact matching may result.
19. Mahalanobis Metric Matching: A Conventional Method Use this method to choose one nonparicipant from multiple matches.
Procedure:
Randomly ordering subjects, calculate the distance between the first participant and all nonparticipants;
The distance, d(i,j) can be defined by the Mahalanobis distance:
where u and v are values of the matching variables for participant i and nonparticipant j, and C is the sample covariance matrix of the matching variables from the full set of nonparticipants;
The nonparticipant, j, with the minimum distance d(i,j) is chosen as the match for participant i, and both are removed from the pool;
Repeat the above process until matches are found for all participants.
20. Mahalanobis in Conjunction with PSM Mahalanobis metric matching is a conventional method. However, the literature suggests two advanced methods that combine the Mahalanobis method with the propensity score matching: (1) Mahalanobis metric matching including the propensity score, and (2) Nearest available Mahalandobis metric matching within calipers defined by the propensity score.
21. Stratification One of several methods developed for missing data imputation
Group sample into five categories based on propensity score (quintiles).
Within each quintile, there are r participants and n nonparticipants. Use �approximate Bayesian bootstrap� method to conduct matching or resampling.
22. Heckman�s Difference-in-Differences Matching Estimator (1)
23. Heckman�s Difference-in-Differences Matching Estimator (2)
24. Weights W(i.,j) (distance between i and j) can be determined by using one of two methods:
Kernel matching:
where G(.) is a kernel
function and ?n is a
bandwidth parameter. Heckman�s Difference-in-Differences Matching Estimator (3)
25.
Local linear weighting function:
Heckman�s Difference-in-Differences Matching Estimator (4)
26. A Summary of Procedures to Implement Heckman�s Approach:
Obtain propensity score;
For each participant, identify all nonparticipants who match on the propensity score (i.e., determine common-support set);
Calculate before-after difference for each participant;
Calculate before-after differences for multiple nonparticipants using kernel weights or local linear weights;
Evaluate difference-in-differences.
Heckman�s Difference-in-Differences Matching Estimator (5)
27. Heckman�s Contributions to PSM(In Our Opinion) Unlike traditional matching, his estimator requires the use of longitudinal data, that is, outcomes before and after intervention;
His estimator employs recent advances in matching (kernel and local linear weights);
By doing this, the estimator is more robust: it eliminates temporarily-invariant sources of bias that may arise, when program participants and nonparticipants are geographically mismatched or from differences in survey questionnaire.
34. Matching of Predicted Probabilities We employed the caliper matching method to match the sample of AOD service users (n=298) to the sample of AOD service nonusers (n=2,460) based on the predicted logit.
Software: SAS macro �GREEDY�.
35. Sample Differences Before and After Matching Before matching (n=2,758: 2,460 AOD service users and 298 nonusers), all 13 variables except marital status and caregiver age are statistically significant.
After matching (n=520: 260 AOD service users and 260 nonusers), only two variables (education & poverty) remain significant.
This indicates that users and nonusers in the new sample share almost exactly the same characteristics, and selection bias has been mitigated in the new sample.
39. Interpretation Issues Weighted or Unweighted Data
Weights are no longer correct after resampling
Unweighted data does not reflect the population
Meaning of other coefficients in model
PSM would need to be conducted to resample to test each other intervention
Generalizability to the entire population
Excluded cases are different than PSM cases�some of these cases might benefit from the intervention
40. Potential Areas of Application: Use national sample as a benchmark, greatly reduce cost of evaluation of new intervention program
Better model causal effect heterogeneity
Missing data imputation
42. A Paradigm Shift in Program Evaluation Implications of PSM Problems and biases in the case of social experiment
Selection bias: self-selection, bureaucratic selection: whether or not can randomization control for these biases?
A criticism to all conventional methods:
No randomized control;
No simple matching;
No simple statistical control;
A paradigm shift in evaluation of counterfactuals!!