Download

1 / 28
280 likes | 444 Views
Systematic Evaluation of Matrix-Based Pattern Matching in Mammals. Jean Valery Turatsinze Universite Libre de Bruxelles SCMBB-ULB EMBRACE RSMD Workshop 2006-11-10 Uppsala - Sweden. Introduction.

E N D
Systematic Evaluation of Matrix-Based Pattern Matching in Mammals Jean Valery Turatsinze Universite Libre de Bruxelles SCMBB-ULB EMBRACE RSMD Workshop 2006-11-10 Uppsala - Sweden
Introduction • An important step in understanding transcriptional regulation of genes is to locate precisely all functional occurrences of transcription factors binding sites (TFBS) in the genomes; • Several tools have been developed to predict putative TFBS in DNA sequences (patser, MatInspector, Match, TESS, MotifLocator...) • General problem: trade between sensitivity and specificity • High score threshold: high specificity, but loss in sensitivity • Low score threshold: high sensitivity but poor predictive value
Questions • Which are the optimal parameters for predicting binding sites in genome sequences ? • Threshold on score • Choice of the background model • Which level of accuracy can we hope to reach ? • We performed a systematic evaluation on the basis of a large collection (166 regulons, 287 PSSM)
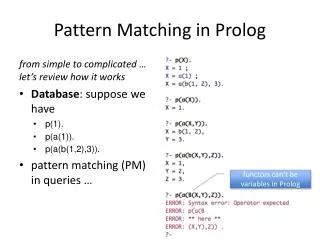
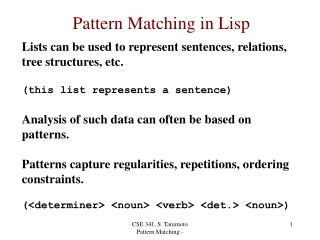
Matrix model: representation of TFBS 1 2 3 4 5 6 7 8 9 10 G G G A C T T T C C G G G G A T T T C C G G G G T T T C C C G G G A A T C T C C G G G A G A T T C C G G G G A T T C C C G G G G A A G C C C G G G A C T T C C C
PSSM: calculation of the probability of a segment S given the matrix model M [P(S/M)] 2nd option: pseudo-weight distributed according to residue priors 1st option: identically distributed pseudo-weight or
Matrix-based pattern matching tools Scan each segment of the sequence and attribute the score: Seq: A T G C G G G A T T T C C G A A T C C T G G A A T C G G A Score
Background model: representation of the sequence Bernoulli model P(S|M): probability of the sequence S given the background model B; ri residue found at the position i of sequence S pri prior probability of the residue ri Markov model P(S|B): probability of the sequence S given the background model B; prj : probability of the residue r at the position j Si : residue at position i; m : Markov model order;
calculation of the probability of a segment S given the background model B [P(S/B)] Markov chain-based background model The probability of each nucleotides depends on the m precedind nucleotides; m being the order of the Markov model Example: Probability of a sequence segment under an order 2 Markov model Seq: A T G C G G G A T T P(S|B) = probability of the sequence given the background model Oligonucleotides frequencies Transition matrix
calculation of the probability of a segment S given the background model B [P(S/B)] Markov chain-based background model The probability of each nucleotides depends on the m precedind nucleotides; m being the order of the Markov model Example: Probability of a sequence segment under an order 2 Markov model Seq: A T G C G G G A T T P(S|B) = probability of the sequence given the background model Seq:A TG C G G G A T T P (S|B) = P(AT) Oligonucleotides frequencies Transition matrix
Background model: representation of the sequence Markov chain-based background model The probability of each nucleotides depends on the m precedind nucleotides; m being the order of the Markov model Example: Probability of a sequence segment under an order 2 Markov model Seq: A T G C G G G A T T P(S|B) = probability of the sequence given the background model Seq:A TG C G G G A T T P(S|B) = P(AT) . P(G|AT) . Oligonucleotides frequencies Transition matrix
calculation of the probability of a segment S given the background model B [P(S/B)] Markov chain-based background model The probability of each nucleotides depends on the m precedind nucleotides; m being the order of the Markov model Example: Probability of a sequence segment under an order 2 Markov model Seq: A T G C G G G A T T P(S|B) = probability of the sequence given the background model Seq: AT GCG G G A T T P(S|B) = P(AT) . P(G|AT) . P(C|TG) Oligonucleotides frequencies Transition matrix
calculation of the probability of a segment S given the background model B [P(S/B)] Markov chain-based background model The probability of each nucleotides depends on the m precedind nucleotides; m being the order of the Markov model Example: Probability of a sequence segment under an order 2 Markov model Seq: A T G C G G G A T T P(S|B) = probability of the sequence given the background model Seq: A TG CGG G A T T P(S|B)= P(AT) . P(G|AT) . P(C|TG) . P(G|CG) Oligonucleotides frequencies Transition matrix
calculation of the probability of a segment S given the background model B [P(S/B)] Markov chain-based background model The probability of each nucleotides depends on the m precedind nucleotides; m being the order of the Markov model Seq: A T G C G G G A T T P(S|B) = probability of the sequence given the background model Seq: A T G C G G GA TT P(S|B) = P(AT) . P(G|AT) . P(C|TG) . P(G|CG). . .P(T|AT) Oligonucleotides frequencies Transition matrix
compare-features: calculation of statistical parameters Sensitivity Positive predictive value Arithmetic accuracy Geometric accuracy General approach: comparison of the predictions with experimentally well characterized sites Genomic sequence TRANSFAC annoteted sites predicted sites compare-features diff diff inter inter False negative FN False positive FP True positive TP Partial overlapping: -->to decide
Distribution of all human, rat and mouse annotated sites • Testing set for the evaluation • All the human transcription factors having a PSSM in TRANSFAC annotations • TRANSPRO promoters from -1000 and -500 to -1 from the transcription start site (TSS) • This choice was justified by the fact most TRANSFAC annotations are restricted to this proximal region (probably due to experimental biases).
Global background model: the model is calibrated on the whole set of transpro promoter TRANSPRO (promoter DB) Calibration of global background model Context 1-->background model 1 All human promoter sequences matrix genomic sequence1 Factor 1: target promoter sequences Context 2-->background model 2 Input sequences-based background model: the model is calculated from target promoter of each TF used as input of the program Adaptive background model: using a sliding window to calculate background model Calibration of background model Calibration of background model Calibration of background model matrix genomic sequence2 Factor 2: target promoter sequences Context 3 -->> background model 3 matrix Factor 3: target promoter sequences genomic sequence3 etc.. Choice of the background sequence set “Global” model “Input” model “Sliding windows model” model
Factor 1 Factor 2 Factor 3 . . . Factor n Annotated sites in their genomic context Factor ID ( TRANSFAC) Target sites in TRANSFAC Promoter sequence in TRANSPRO background models Position weight matrices PWM (TRANSFAC ) Pattern matching predicted sites comparisons compare-features pMatchingEval flow chart
Accuracy profiles (500 bp promoter) Global BG input BG
Accuracy profiles (500 bp promoter) Sliding window 500nt BG Global BG Sliding window 300nt BG Sliding window 400nt BG Sliding window 100nt BG Sliding window 200nt BG
Conclusions • Score optimizing accuracy variable according to the matrix considered, • Even for the same TF different matrices give different optimal parameters • Background model impact : • Global calibration is generally slightly better than factor-specific and sliding windows calibration • Order of the Markov chain: • For some matrices the effect is marginal • For other matrices the effect is erratic • General trends (median profiles): almost no effect for global model • For sliding windows: higher order Markov chains (>0) give bad results due to the short size of training sets (several transition are not observed) • Optimal parameters should be selected on a case by case basis using this approach
Acknowledgements SCMBB Lab Jacques van Helden Olivier Sand Raphaël Leplae Rekin’s Janky Karoline Faust Sylvain Brohée Ariane Toussaint Gipsi Lima Mendez Marc Lesink Benoit Dessailly Raul Mendez RSAThttp://rsat.scmbb.ulb.ac.be/rsat/ PhD Funding F.R.I.A. (FNRS)
Adaptive background models:Motivations • Heterogeneity of nucleotide composition of promoters • GC content analysis of promoters (500bp) and matrices