Download
1 / 23
230 likes | 235 Views
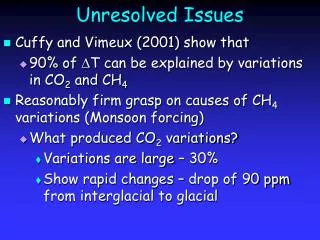
The Sun’s Irradiance Variations. Sunspot Number. Sunspot number 1620 –2000. The Sun in X-Ray Light. Solar Activity Minimum --1996. Solar Activity Maximum--2000. What about Climate Change? Where Does the Sunlight Go?. Greenland Ice Core Temp. Data. The Younger Dryas - Global.

E N D
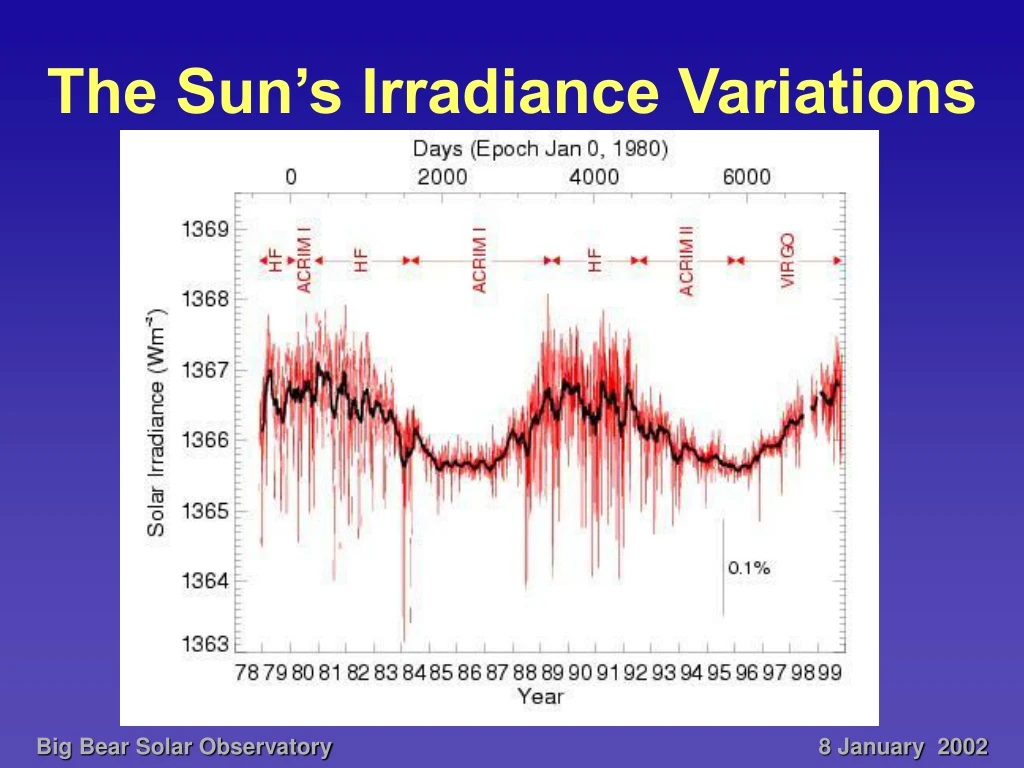
The Sun’s Irradiance Variations Big Bear Solar Observatory
Sunspot Number • Sunspot number 1620 –2000 Big Bear Solar Observatory
The Sun in X-Ray Light Solar Activity Minimum --1996 Solar Activity Maximum--2000 Big Bear Solar Observatory
What about Climate Change? Where Does the Sunlight Go? Big Bear Solar Observatory
Greenland Ice Core Temp. Data Big Bear Solar Observatory
The Younger Dryas - Global Big Bear Solar Observatory
Pattern of Ice Ages Big Bear Solar Observatory
Albedo Climate Heat Engine Big Bear Solar Observatory
The Earth’s Albedo is Highly Variable • Local albedo depends upon: • Surface type • Solar zenith angle (time of day) • Meteorology (clouds) • The global albedo varies with the seasons • North/South land symmetry • Snow/ice cover Big Bear Solar Observatory
Satellites are the standard way to measure the albedo • Low-earth orbit (few 100 km) • Observe one spot (10 km) at at time; average over pixels • Incomplete space/time coverage • Expensive • Tough to calibrate at a fraction of a percent • Subject to failures (none now working) • Complex scene models required to analyze data • Precision of about 0.7% Big Bear Solar Observatory
Earthshine is Reflected from the Earth to Illuminate Moon • Ghostly glow of the dark part of the lunar disk • E/S ~Albedo X geometry X moon properties • Intensity varies during the month • Largest when phase ~ (full earth, crescent moon) • Smallest when phase ~0 (full moon, crescent earth) • Measured by A. Danjon (1927-34) and J. Dubois (1940-1960) Big Bear Solar Observatory
Earthshine and the Earth • Measure and Simulate Earth’s reflectance and spectra and their variations. Reflectance from BBSO Spectra from Palomar • Principal Non-BBSO Collaborators Steve Koonin, Caltech Titus Brown, Caltech Big Bear Solar Observatory
Earthshine • Net Sunlight Reaching Earth Drives the Climate • About 30% of Incident Sunlight Reflected by Our Blue Earth • Origin of Earthshine First Explained by DaVinci Big Bear Solar Observatory
Simulations of Albedo • Scene Models from Earth Radiation Budget, where earth is divided into 12 scenes • Take cloud cover data from web, updated every 6 hours (www.intellicast.com) • Snow and ice cover from Canadian Center for Climate Modeling and Analysis (www.ccma.bc.ec.gc.ca) • Calculate albedo for parts of the Earth in earthshine Big Bear Solar Observatory
Two Typical Nights Big Bear Solar Observatory
Observations of the Earthshine • Our fiducial points – chosen to be in the highlands near the lunar limb • Each has its own lunar phase function Big Bear Solar Observatory
Danjon’s Lunar Phase Function vs. Ours for Morning and Evening The Lunar Phase Function – Scattering from the Moon Big Bear Solar Observatory
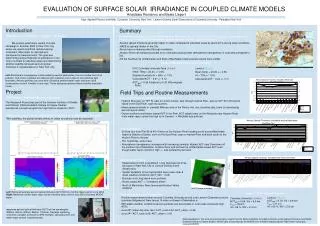
Observations (A=0.297 0.005) & Simulations (A=0.296 0.002) of Bond Albedo from Earthshine Big Bear Solar Observatory
Earthshine Simulations vs. Whole Earth Albedo Big Bear Solar Observatory
The Earth’s Albedo: Results • From 1999-2000 observations : A=0.297 0.005 • From 1999-2000 simulations: A=0.296 0.002 • The difference in errors is due 20% seasonal variation in observations (10% in simulations) • Some 1994-1995 results imply albedo that is 2.5% 1.8% larger Big Bear Solar Observatory
Bond Albedo Integrand Big Bear Solar Observatory
Seasonal Changes: Observations & Simulations • Observations show 20% seasonal variations • Too much smoothing in simulations Big Bear Solar Observatory
Some Spectral Results from 60’’ on Mt. Palomar Big Bear Solar Observatory