Download
1 / 38
380 likes | 464 Views
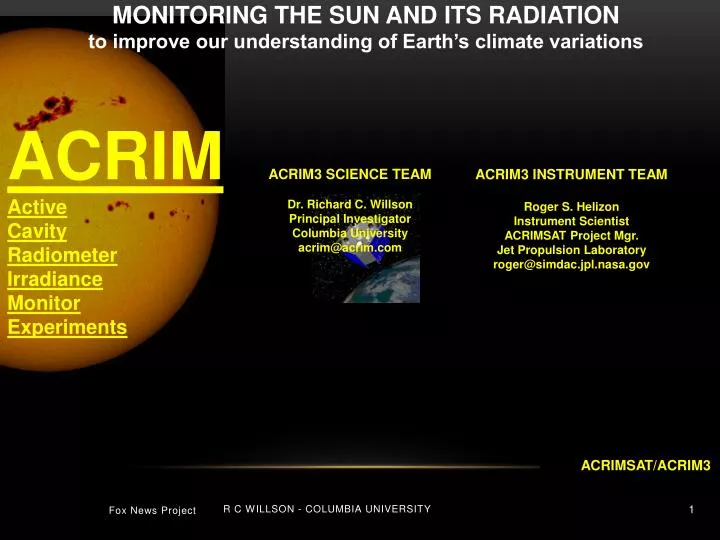
MONITORING THE SUN AND ITS RADIATION to improve our understanding of Earth’s climate variations. ACRIM Active Cavity Radiometer Irradiance Monitor Experiments. ACRIM3 SCIENCE TEAM Dr. Richard C. Willson Principal Investigator Columbia University acrim@acrim.com.

E N D
MONITORING THE SUN AND ITS RADIATION to improve our understanding of Earth’s climate variations ACRIM Active Cavity Radiometer Irradiance Monitor Experiments ACRIM3 SCIENCE TEAM Dr. Richard C. Willson Principal Investigator Columbia University acrim@acrim.com ACRIM3 INSTRUMENT TEAM Roger S. Helizon Instrument Scientist ACRIMSAT Project Mgr. Jet Propulsion Laboratory roger@simdac.jpl.nasa.gov ACRIMSAT/ACRIM3 R C Willson - Columbia University
Constructing composite TSI time series: bridging the ACRIM ‘gap’ ACRIM ‘GAP’ 0.35 % R C Willson - Columbia University
Constructing composite TSI time series: bridging the ACRIM ‘gap’ ACRIM ‘GAP’ ACRIM ‘GAP’ 0.35 % R C Willson - Columbia University
Satellite TSI Observations, Scales and Traceability • TSI database sustained since 1980 by redundant, overlapping experiments • Precise traceability (relative precision) is the most important quality of the database Sensor degradation calibration is the primary contributor to precise traceability TSI monitoring experiments self-calibrate degradation using redundant sensors TSI database traceability 1980 – 2005: ~ 100 ppm Current state of the art: ~ 5 ppm/yr • TSI database cannot be sustained by measurement accuracy TSI experiments self-calibrate in the International System of Units (SI) Calibration is based on pre-flight sensor metrology Scale differences result from systematic metrology errors SI uncertainty varies among experiments but none are significantly less than ~ 0.1 % R C Willson - Columbia University
Rationale for ‘bridging’ the ACRIM Gap and constructing a composite TSI time series R C Willson - Columbia University
Trend: + 0.04 %/decade R C Willson - Columbia University
Trend: - 0.01 %/decade R C Willson - Columbia University
Relative effects of ERB & ERBE ACRIM ‘gap’ ratios on TSI composites R C Willson - Columbia University
Paradigm Test of ERB and ERBE ACRIM ‘gap’ ratios • TSI variability paradigm: TSI is proportional to solar magnetic activity on solar cycle time scales • During the ACRIM ‘gap’ the average solar magnetic activity level increased steadily • The Nimbus7/ERBupward trend during the ‘gap’ is compatible with the paradigm • The ERBS/ERBEdownward trend during the ‘gap’ is incompatible with the paradigm • ERBE degradation during ACRIM ‘gap’ equals the ACRIM - PMOD trend difference R C Willson - Columbia University
NASA/NIST TSI Workshop Day2 • A NASA/NIST TSI Workshop was convened in July 2005 with the following purposes: Investigate the 0.35 % ACRIM3_VIRGO - TIM scale difference Provide a state of the art assessment of TSI satellite monitoring • The Day2 discussions focused on the traceability of satellite TSI experiments’ launch calibrations throughout both their missions and the duration of the 27 year TSI database R C Willson - Columbia University
NASA/NIST TSI Workshop Day2: ACRIM Calibration Traceability R C Willson - Columbia University
NASA/NIST TSI Workshop Day2: SOHO/VIRGO Calibration Traceability SOHO gap SOHO Hiatus Attribution: C. Frohlich NASA/NIST TSI Workshop R C Willson - Columbia University
NASA/NIST TSI Workshop Day2: SORCE/TIM Calibration Traceability SOHO gap R C Willson - Columbia University
NASA/NIST TSI Workshop Day2 Conclusions • The 0.35 % ACRIM3_VIRGO - TIM scale difference cannot be explained • Additional experimental work is required: Comparisons of ACRIM3, VIRGO and TIM sensor technology with NIST laboratory laser-based scale transfer standards Real time comparisons of ACRIM3, VIRGO and TIM sensor technology using the sun as the source at the JPL Table Mtn. Solar Test Site R C Willson - Columbia University
The sun and its significance in our lives (Click image to activate video) Graphic credit: NASA R C Willson - Columbia University
SOLAR FACTS • The Sun is an ionized gaseous spheroid • 75 % Hydrogen & 25 % Helium • Contains 99.8 % of all solar system mass • Core: extends to 200,000 km • Temperature ~ 15 millionK • Energy generated by nuclear fusion • 60 % of solar mass • 2 % of solar volume • Radiative zone: • Extends to 500,000 km • Energy transported outward by radiation • Convection zone • Extends to 700,000 km • Energy transported outward by convection • Photosphere • 1000 km layer above convection zone • Radiates > 99 % of solar energy to space Age: ~ 4.5 billion years Mass: 333,000 Earth masses Size: 109 Earth diameters Luminosity: ~ 400 x 10 24 Watts R C Willson - Columbia University
Basic solar structure and energy processes (Click image to activate video) Graphic credits: NASA R C Willson - Columbia University
The Solar Magnetic Field • The Radiative Zone and the Convective Zone rotate at different rates • Relative movements of Ionized gas at Interface Layer large electrical current flows • Strong magnetic fields are associated with current flows • Current flows are locked into the rotating plasma of the convection zone R C Willson - Columbia University
The Solar Magnetic Cycle • Solar magnetic field is longitudinal • (pole-to-pole) early in the cycle (Stage 1) • Differential rotation in convection zone ‘winds up’ magnetic flux lines, making them stronger near the solar equator (Stage 2) • Polar rotation rate ~ 33 days • Equatorial rotation rate ~ 25 days • ‘Wind-up’ concentrates magnetic fields • Magnetic fields ‘float’ up through the photosphere causing ‘active regions’ with sunspots and faculae (Stage 3) • Magnetic fields expand outward, carrying plasma into space, creating the ‘solar wind’ (Stage 4) R C Willson - Columbia University
Solar magnetic activity and dynamics (Click image to activate video) Graphic credits: NASA R C Willson - Columbia University
Active Region Life Cycle: Sunspots (Click image to activate video) • Active regions begin with sunspots • Active regions lifetime ≤ 180 days • Avg. solar rotation rate ~ 27 days • Sunspot lifetimes ≤ 3 rotations • Sunspot brightness ~ 25% of average photosphere Figure Credit: solar2.stanford.edu/sunspotssu/#movies R C Willson - Columbia University
Effects of Sunspots and Faculae on Solar Radiation Results from the SMM/ACRIM1 Experiment • Sunspots decrease solar radiation • Temporary decreases up to - 0.25 % • Decreases last for ~ 1 week • Faculae increase solar radiation • Temporary increases up to + 0.05 % • Increases last up to 6 months Figure Credit: Willson & Hudson R C Willson - Columbia University
Solar Magnetic Cycles • Sunspot (cycle • Lasts 9 - 12 years • Magnetic polarity reversal at maximum • Magnetic (Hale) cycle • Lasts ~ 18 – 24 yr • Complete cycle of magnetic polarity Figure credit: NASA/MSFC R C Willson - Columbia University
Does Climate Vary with Solar Variability ? • Climate has varied significantly during the past 1000 years • Climate and sunspots are linked by the 14C record • Total Solar Irradiance and sunspots are linked through ACRIM satellite observations • Climate has ranged from ~ 2 F warmer to ~ 3 F colder during the last millennium Average Climate Figure credit: Jack Eddy R C Willson - Columbia University
Why Do We Monitor the Sun’s Radiation ? • To answer the following questions: • How do solar variations affect the Earth’s climate ? • How much and how often does solar radiation vary ? • What causes the sun’s radiation to vary ? • Can we predict future solar variation and its affect on climate ? R C Willson - Columbia University
The History of Solar Radiation Monitoring • Smithsonian Astrophysical Observatory ground-based observations (1880 ) • Interest in sun–climate connection since late 1800’s (Langley) • Developed solar radiation measuring instruments: 1880 -1910 • Measured solar radiation from mountain-top observatories: 1903 – 1963 (Abbot) • The Smithsonian monitored TSI from Mt. Montezuma (Chile) and the Table Mtn. (CA) site for decades during the 1st half of the 20th century ACRIM Solar Test Facility Jet Propulsion Laboratory’s Table Mt. Observatory Near Wrightwood, CA Smithsonian Astrophysical Observatory Mt. Montezuma, Chile R C Willson - Columbia University
The History of Solar Radiation Monitoring • X-15 aircraft observations: 1960’S • Stratospheric balloon observations: 1960’s – 1970’s • Sounding rocket observations: 1970’s – 1980’s • Space Shuttle Observations: 1980’s – 1990’s • Satellite observations: 1978 present R C Willson - Columbia University
Active Cavity Radiometer Instrumentation ACRIMSAT/ACRIM3 Sensor ACRIMSAT/ACRIM3 Instrument ACRIMSAT/ACRIM3 Sensor Module R C Willson - Columbia University
ACRIM3 Instrument and ACRIMSAT Satellite ACRIM3 Instrument ACRIMSAT Satellite R C Willson - Columbia University
TAURUS LAUNCHVEHICLE ACRIMSAT INTEGRATION OF ACRIMSAT/ACRIM3 WITH TAURUS 4TH STAGE AT VANDENBURG AFB R C Willson - Columbia University
ACRIMSAT/ACRIM3 LAUNCH DEC. 20, 1999 Launch from Vandenburg AFB ACRIMSAT deployed in orbit ACRIMSAT Ground Station at Table Mt. Observatory R C Willson - Columbia University
ACRIMSAT/ACRIM3 LAUNCH DEC. 20, 1999 ACRIMSAT Launch from Vandenburg AFB ACRIMSAT deployed in orbit R C Willson - Columbia University
TSI/Solar Active Region Feature Correlations BBSO CaK 10/12/01 BBSO CaK 02/15/02 MOWL 4/25/00 BBSO WL 8/17/02 BBSO WL 4/02/02 BBSO WL 7/29/02 MOWL 5/19/00 MOWL 9/21/00 MOWL 3/29/01 R C Willson - Columbia University
19th and 20th Century TSI VariationCoronal Source Magnetic Flux Drift Proxy I = TSI(Lockwood & Stamper) I11 = TSI 11 yr. mean (Lockwood & Stamper) LEA = TSI from Sunspot Number Proxy model (J. Lean) Figure credit: M. Lockwood and R. Stamper R C Willson - Columbia University
19th and 20th Century TSI and Climate Variation Proxies Northern Hemisphere Temperature Anomalies As a Function of Solar Activity Cycle Length Sea Surface Temperature Anomalies As a Function of Sunspot Number Solar Cycle Length Year Figure credit: E. Friis-Christensen Figure credit: G. Reid Figure credit: E. Friis-Christensen R C Willson - Columbia University
Climate Forcing by Extrinsic TSI Variations: Milankovitch Cycles Variations in the Earth’s orbital parameters induce subtle variations in TSI Figure credit: Scott Rutherford University of Rhode Island Figure credit: UCAR R C Willson - Columbia University
High Energy Radiation from Active Regions The sun in the far ultra violet (304 A) • Chromosphere • Emits strong Ultra Violet Radiation • Flares erupt producing X-Radiation • Corona • Coronal hole • Prominences extend 200,000 Km • Plasma ejected into solar wind Coronal Mass Ejection Graphics credit: NASA/ESA SOHO R C Willson - Columbia University
Solar Global Oscillation (‘ringing’) • The sun can oscillate (‘ring like a bell’) • ‘5 minute’ pressure oscillations confined to convection zone • Gravity mode oscillations extend throughout the sun • Helioseismology • Study of sun’s interior by observing ‘ringing’ modes • Similar to technique of prospecting for oil deposits on Earth Graphics credit: NASA-ESA SOHO/MDI R C Willson - Columbia University