Download
1 / 56
610 likes | 916 Views
Approaches to Research. Week 2 (Dornyei, 2007 , p.24-47 ). Dr. Hale Işık-Güler 2009-2010. Types of research in Social S ciences :. QUALITATIVE RESEARCH. QUAN TITATIVE RESEARCH. MIXED METHODS RESEARCH. Research Methods.

E N D
Approaches to Research Week 2 (Dornyei, 2007, p.24-47) Dr. Hale Işık-Güler 2009-2010
Types of research in SocialSciences: • QUALITATIVE RESEARCH • QUANTITATIVE RESEARCH • MIXED METHODS RESEARCH
Research Methods • Research methods are generally categorised as being either quantitative or qualitative. • What matters is that the methods used fit the intended purposes of the research!
Qualitative and Quantitative Paradigms • The qualitative paradigm concentrates on investigating subjective data, in particular, the perceptions of the people involved. The intention is to illuminate these perceptions and, thus, gain greater insight and knowledge. • The quantitative paradigm concentrates on what can be measured. It involves collecting and analysing objective (often numerical) data that can be organised into statistics.
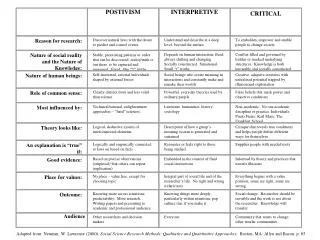
qualitative quantitative subjective objective inductive deductive participant observation survey techniques anthropology sociology naturalism anti-naturalism art science hermeneutics positivism aristotelian galilean teleological causal finalistic mechanistic understanding explanation phenomenological logical positivism * bad *good descriptive predictive empiricism rationalism atheoretical theoretical Main distinctions seen between quantitative and qualitative ‘paradigms’ - Common dichotomies in methodological literature
The roots of current debates • Early debates: from 17th century to the first half of 20th centuries • Prosperity of positivism and the domination of quantitative methods in social sciences: from 1930s to 1950s • The debunking of logical positivism after World War II and the pervasiveness of the postpositivist position: the end of 1950s and beginning of 1960s • The ascendance of interpretivism and constructivism, followed by the ‘paradigm wars’: from late 1960s onwards
Qualitative Goal: To Understand, Predict Descriptive accounts Similarities and Contrasts Applied and Theoretical Research Questions Field study Natural conditions Quantitative Goal: To Predict and Control Measure and Evaluate Generalize to population, reproduction Basic and Theoretical Hypothesis testing Lab study Controlled, contrived Research MethodologiesA continuum rather than “either/or”
Quantitativedata: Most commonly expressed in NUMBERS E.g aptitude test score TOEFL score Number of times astudent volunteered inclass Qualitativedata: Usually involves recorded spoken data that is transcribed to textual form as well as written data E.g. interview data Diary entries field notes other documents Qualitative and quantitative DATA
Language data: (may be subsumed under qualitative data) • Language samples in various length elicited from repondents primarily for the purpose of LANGUAGE ANALYSIS E.g. -A recorded language task -Solicited student essay (for discourse analysis) - Corpus data
The qualitative-quantitative distinction • Ideological differences • Reformists; distaste for mainstream quantitative paradigm • Contrasting categorizing/coding practices • Social world data needs to be reduced (categories and codes) • QUAN: numerical precise coding tables (values) before study begins: M:1, F: 2 • QUAL: short verbal textual labels
Different approaches to individual diversity • QUAN: Diversity is a problem that needs to be fixed (large sample, commonalities-idiosyncrasies (Meaning in the general) • QUAL: -loose individual stories; real meaning lies with individual cases that make up the world (Meaning in the particular) • Statistics versus researcher sensitivity • QUAN: Meaning in numbers; greater the sample the more ‘normal’ the distribution (bell-shaped curve). This idea originally led to the development of statistics.
QUAL-QUAN contrast and the “paradigm war” • Categorizing the world • Predetermined numerical category system • Emergent, flexile coding • Perceiving individual diversity • Using large samples to iron out any individual idiosyncrasies • Focusing on the unique meaning carried by individual organisms • Analysing data • Relying on the formalized system of statistics • Relying on the researcher’s individual sensitivity
Quantitative research is: • "a formal, objective, systematic process in which numerical data are utilised to obtain information about the world"
Quantitative Methods • quantitative research typically seeks to generalize to a large population. It is “hypothetically” more objective and less interpretive. • Some of the most frequently utilized types of quantitative methods in applied lingusitics research include: • Surveys • Experimental Design Tools
Quantitative Research Scientific method: • Identifying a problem, • Formulating a hypothesis, • Testing the hypothesis by • collecting and analyzing • empirical data using • standardized procedures.
a hypothesis • a hypothesis is a tentative explanation for certain behaviors, phenomena, or events that have occurred or will occur. 1. The hypothesis states the researcher's expectations concerning the relationship between the variables in the research problem. 2. The hypothesis is a refinement of the research problem. It is the most specific statement of the problem. 3. The hypothesis states what the researcher thinks the outcome of the study will be. 4. The researcher collects data that either supports the hypothesis or does not support it.
5. The hypothesis is formulated following the review of related literature and prior to the execution of the study. The related literature leads the researcher to expect a certain relationship. 6. "A good hypothesis states as clearly and concisely as possible the expected relationship (or difference) between two variables and defines those variables in operational, measurable terms." 7. "A well-stated and defined hypothesis must be (and will be if well-formulated and stated) testable. It should be possible to support or not support the hypothesis by collecting and analyzing data."
hypotheses for an experimental or causal-comparative study: If X is the independent variable, Y is the dependent variable, and S is the Subject, we can state our research hypothesis as Ss who get X do better on Y than subjects who do not get X (or get some other X). Research Hypothesis: Girls will achieve higher reading comprehension test scores than boys at the end of the first grade. The null hypothesis:There will be no difference between the two means on the reading comprehension test scores hypotheses for correlational research: If A and B are variables (note that we do not refer to them as independent and dependent variables in correlational research), and C is the subject we can state our research problem as the relationship between A and B for C. (What is the relationship between A and B for C) Research Hypothesis: The length of time needed to complete an examination will be negatively correlated with the score on the examination for uni. students.
Another Example • The following is a hypothesis for a study. 1. "There will be a statistically significant difference in graduation rates of at-risk high-school seniors who participate in an intensive study program as opposed to at-risk high-school seniors who do not participate in the intensive study program." (LaFountain & Bartos, 2002, p. 57) IV: Participation in intensive study program. DV: Graduation rates.
Main Characteristics of Quantitative Research(p.33-34) • Using numbers • A priori categorization • Variables rather than cases • Statistics and language of statistics • Standardized procedures to assess objective reality • Quest for generalizability and universal laws
William Gossett - nicknamed ‘Student’ was a chemist at the Guinness brewery in Dublin and developed the student t-test in 1908 to ensure that each batch of Guinness was as similar as possible to every other batch! The t-test is used to compare two groups. 3 different types can be performed:
Paired t-test: used when each data point in one group corresponds to a matching datapoint in the other group. • Unpaired t-test: used whether or not the groups contain matching datapoints: o Two-sample assuming equal variances o Two-sample assuming unequal variances
So, how is a variable defined? • A variable is an object, event, idea, feeling, time period, or any other type of category you are trying to measure. There are two types of variables-independent and dependent. • It is critical to categorize variables as being dependent or independent Dictates which type of statistical test should be performed – Is one variable likely to be influenced by the other? – Is variation in one variable likely to be uninfluenced by the other?
In an experiment... • the independent variableis the variable that is varied or manipulated by the researcher, and the dependent variableis the response that is measured. • An independent variable is the presumed cause, whereas the dependent variable is the presumed effect.
What's an independent variable in research? • An independent variable is exactly what it sounds like. It is a variable that stands alone and isn't changed by the other variables you are trying to measure. • For example, someone's age might be an independent variable. Other factors (such as what they eat, how much they go to school, how much television they watch) aren't going to change a person's age. In fact, when you are looking for some kind of relationship between variables you are trying to see if the independent variable causes some kind of change in the other variables, or dependent variables.
What's a dependent variable in research? • Just like an independent variable, a dependent variable is exactly what it sounds like. • It is something that depends on other factors. • For example, a test score could be a dependent variable because it could change depending on several factors such as how much you studied, how much sleep you got the night before you took the test, or even how hungry you were when you took it. Usually when you are looking for a relationship between two things you are trying to find out what makes the dependent variable change the way it does.
Many people have trouble remembering which is the independent variable and which is the dependent variable. • An easy way to remember is to insert the names of the two variables you are using in this sentence in they way that makes the most sense. Then you can figure out which is the independent variable and which is the dependent variable: (Independent variable) causes a change in (Dependent Variable) and it isn't possible that (Dependent Variable) could cause a change in (Independent Variable).
For example: • (Time Spent Studying) causes a change in (Test Score) and it isn't possible that (Test Score) could cause a change in (Time Spent Studying). • We see that "Time Spent Studying" must be the independent variable and "Test Score" must be the dependent variable because the sentence doesn't make sense the other way around.
Software • Spreadsheets • EXCEL • Statistical Software • SPSS (http://www.spss.com/) • MINITAB (http://www.minitab.com/) • SAS (http://www.sas.com/)
Strengths of Quantitaive Research Quantitative research • “is systematic, • rigorous, • focused, and • tightly controlled, • involving precise measurement and • producing reliable and • replicable data that is • generalisable to other contexts” (Dörnei, 2007, p. 34).
Although the preparation period takes quite a long time, “the research process is relatively quick and offers good value for money, particularly because the data analysis can be done using statistical computer software” (Dörnei, 2007, p. 34).
Weaknesses of Quantitaive Research • “Quantitative methods average out responses across the whole observed group of participants and by working with concepts of averages it is impossible to do justice to the subjective variety of an individual life” (Dörnei, 2007, p. 35)
Similar scores can result from quite different underlying processes • Quantitative methods are not very sensitive in finding out • the reasons for particular observations • the dynamics underlying the examined situation or phenomenon
In other words, • For some people, “the general exploratory capacity of quantitative research is rather limited”(Dörnei, 2007, p. 35) .
Thinking it through . . . • Suppose you wondered how students use instructor feedback from the first draft of their papers to write the second draft. How might you design a quantitative investigation to address this question? • …
Qualitative Research Qualitative research came about as a reaction to the “hard-core” quantitative research.
Qualitative research • ‘qualitative research is difficult to define clearly. It has no theory or paradigm that is distinctly its own. ...Nor does qualitative research have a distinct set of methods or practices that are entirely its own’, (pp.6-7) • ‘Qualitative research is many things to many people’ (p. 10)(Denzin and Lincoln as cited by Dörnei, 2007, p. 35) • Some believe there is lack of uniformity • A thriving discipline
Qualitative Methods • Qualitative methods are used to “understand” more deeply, reach a ‘THICK’ description. Typically results do not seek to generalize widely. • Some of the most frequently used types of qualitative methods in applied linguistics research are: • Interviews/focus groups • text or discourse analysis • (think-aloud) protocol analysis • observational work, field notes • Diary entries • Supporting documents • Images, videos, etc.
Main characteristics of qualitative data • Emergent research design; grounded theory designs • flexible, no aspect is tightly prefigured, enter the process with an open mind • The nature of qualitative data (i.e. texts) • The characteristics of the research setting • Natural setting, no manipulations; prolonged contact • ‘Insider’ meaning • Reaching subjective opinions, feelings of individuals; goal is to explore participants views of the situation being studied • Small(er) sample size • Interpretive analysis • The research outcome is ultimately the product of the researchers subjective interpretation of data • The researcher is essentially the main ‘measurement device’ in the study!
Strengths of qualitative research (p.39-40) • Exploratory nature(exploring new uncharted areas) • Making sense of complexity • Answering “why” questions • Broadening our understanding(‘not’ correct, but possible interpretations) • Good starting point for longitudinal examination of dynamic phenomena • Flexibility when things go wrong • Design allows for change/alterations • Rich material for research report • tables vs. detailed descriptions
Weaknesses of qualitative research • Sample size and generalizability • Researcher role • (influence, bias, observer’s paradox) • Lack of methodological rigour • Too complex or too narrow theories from the indivdual cases studied • Time consuming and labour intensive (reason why sample sizes are small!)
Thinking it through . . . • Suppose you wondered how students use instructor feedback to write the second draft of a paper. How might you design a qualitative investigation to address this question? • ...
Mixed methods research • is a combination of qualitative and quantitative methods within a single research project • How can QUAL and QUAN work together (inform each other, give feedback to one another)?
Main characteristics of mixed methods research • the combination of the main characteristics of quantitative and qualitative methods research.
The real breakthrough for the method occurred in 1970 with the introduction of the concept of triangulation
Mixed Methods Research Triangulation (in naval navigation): The process of establishing the unknown position of a spatial point, A, by using the measurementsfrom two known points, B and C.
Mixed Methods Research Triangulation (in social sciences): The process of investigating a certain phenomenon by using different (multiple) methods.