Download
1 / 5
50 likes | 144 Views
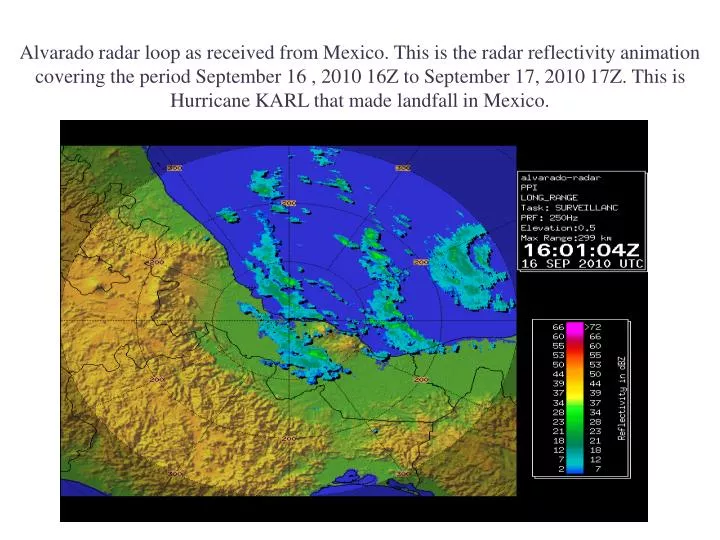
Alvarado radar loop as received from Mexico. This is the radar reflectivity animation covering the period September 16 , 2010 16Z to September 17, 2010 17Z. This is Hurricane KARL that made landfall in Mexico.

E N D
Alvarado radar loop as received from Mexico. This is the radar reflectivity animation covering the period September 16 , 2010 16Z to September 17, 2010 17Z. This is Hurricane KARL that made landfall in Mexico.
Alvarado radar data converted to rainfall (mm/hour) at model resolution of 1.33 km. Animation of rainfall during the landfall of Hurricane KARL. RAINFALL USED IN MODEL AFTER INTERPOLAION AT 1.33O LAT/LON GRID
RADAR REFLECTIVITY AS OBTAINED FROM IMD, CHENNAI 2011 DECEMBER 2903z to 3000z