Download

1 / 55
560 likes | 753 Views
Diabetes. Asmi Shah, Brittany Cox, Clara Bergeron, Nang Pann Ei Kham. Overview. In 2011, approximately 20 million American Diabetes is a chronic disease in which there is a high level of sugar in the blood Diabetes is caused: Pancreas does not make enough insulin

E N D
Diabetes Asmi Shah, Brittany Cox, Clara Bergeron, Nang Pann Ei Kham
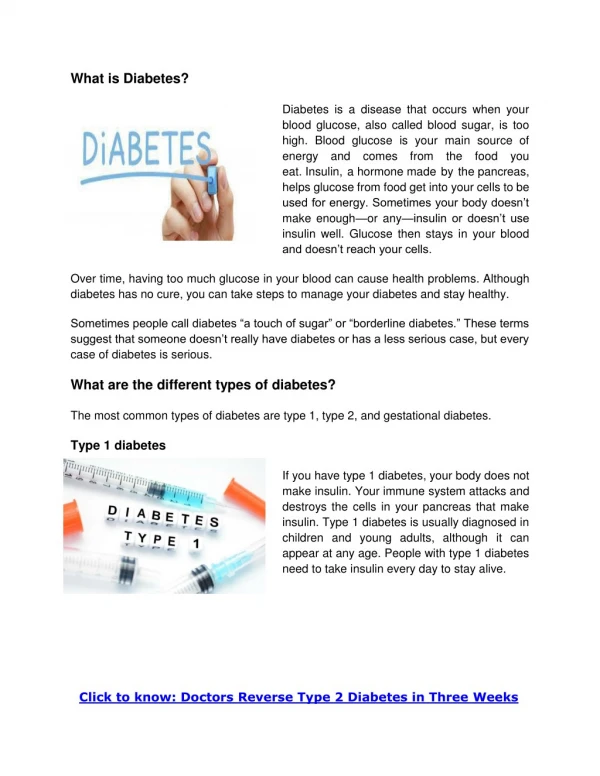
Overview • In 2011, approximately 20 million American • Diabetes is a chronic disease in whichthere is a high level of sugar in the blood • Diabetes is caused: • Pancreas does not make enough insulin • Cells do not respond normally to insulin being produced • Both • Insulin is a hormone produced by the pancreas to control blood sugar
Overview cont’d. • The role of insulin is to move glucose from the bloodstream into muscle, fat, and liver cells, where it can be used as fuel • Diabetes = Body cannot move sugar into muscle, liver, and fat cells to be stored for energy • Lack of sufficient insulin supply to the body • There are two major types of diabetes • Type 1 and Type 2 • Gestational Diabetes (Minor type of diabetes)
Types of Diabetes • Type 1 Diabetes • Most often diagnosed in children, teens, or young adults • The body makes little or no insulin • Daily injections of insulin are needed • Manually or through an insulin pump • Type 2 Diabetes • Makes up most diabetes cases • Most often occurs in adulthood • High obesity rates = teens and young adults are now being diagnosed with it • Many people with type 2 diabetes do not know they have it • Gestational Diabetes • High blood sugar develops at any time during pregnancy in a woman who does not have diabetes prior to pregnancy
Risk Factors Type 1 Diabetes • Genetics and family history • The ADA recommends that anyone with a first-degree relative with type 1 diabetes is at higher or increased risk • Simple blood test can used to diagnose • Diseases of the pancreas • Injury or diseases of the pancreas can inhibit its ability to produce insulin and lead to type 1 diabetes • Infection or illness • A range of relatively rare infections and illnesses can damage the pancreas and cause type 1 diabetes
Risk Factors for Type 2 Diabetes • Obesity or being overweight • Research at the Harvard School of Public Health showed that the single best predictor of type 2 diabetes is being obese or overweight • BMI of 25 to 29.9 is considered overweight • BMI of 30 or higher considered obese
Other Risk Factors • May accelerate the harmful effects of diabetes • Smoking • Physical Inactivity • Hypertension • High Cholesterol
Current Treatment Options • Type 2 diabetes can be reversed with lifestyle changes • Losing weight through: • Exercising • Eating healthier foods • Some cases, weight-loss surgery • Currently type 1 diabetes can not be reversed • Treating both types of diabetes involves medicines, diet, and exercise to control blood sugar level
Medication • Metformin (oral antidiabetic drug) • First line treatment for type 2 diabetes • When insulin is used in type 2 diabetes • A long-acting formulation is usually added • While continuing oral medications • Type 1 diabetes is typically treated with a combinations of regular and synthetic insulin
To prevent diabetes complications • Visit health care providers at least two to four times a year • Talk about any problems that arise
Age-Adjusted Prevalence of Diagnosed Diabetes Among US Adults, 1994-2010
Prevalence of Diagnosed Diabetes in all Individuals in the United States, 1980-2011 Diabetes is becoming more common in the United States. Total number of diagnosed individuals has tripled in just 30 years. 1980 - 5.6 million people 2011 - 20.9 million people http://www.cdc.gov/diabetes/statistics/prev/national/figpersons.htm
Percentage of Civilians with Diagnosed Diabetes, By Age, United States, 1980-2011 • Ages 0-44 (0.6% - 1.6%) • Ages 45-64 (5.5% - 12.0%) • Ages 65-74 (9.1% - 21.8%) • Ages 75+ (8.9% - 20.0%) http://www.cdc.gov/diabetes/statistics/prev/national/figbyage.htm
Age-Adjusted Percentage of Civilians with Diagnosed Diabetes by Education, United States, 1980-2011 • Less than high school education (3.4% - 8.6%) • With a high school education (2.4% - 7.5%) • More than high school education (2.2% - 5.9%) http://www.cdc.gov/diabetes/statistics/prev/national/figbyeducation.htm
Age-Adjusted Percentage of Individuals with Diabetes, by Sex, United States, 1980-2011 • 1980-1998 similar for both • 1999 onwards, percentage of men increase at a faster rate than women • Men (2.7% - 6.9%) • Women (2.9% - 5.9%) http://www.cdc.gov/diabetes/statistics/prev/national/figbysex.htm
Age-Adjusted Percentage of Civilians with Diabetes, by Race, United States, 1980-2011 • Whites (2.6% - 5.9%) • Blacks (4.5% - 9.3%) • Asians (3.9% - 6.5%) from 1997-2011 http://www.hopkinsmedicine.org/healthlibrary/conditions/diabetes/diabetes_statistics_85,P00353/ http://www.cdc.gov/diabetes/statistics/prev/national/figbyrace.htm
Age-Adjusted Percentage of Civilians with Diabetes, by Race and Sex, United States, 1980-2011 • White males (2.5% - 6.5%) • White females (2.6% - 5.4%) • Black males (4.0% - 9.9%) • Black females (4.9% - 9.0%) • Asian males (4.3% - 7.8%) • Asian females (3.7% - 5.5%) • Asian individuals show data from 1997-2011 http://www.cdc.gov/diabetes/statistics/prev/national/figraceethsex.htm
Age-Specific Percentage of Civilians with Diabetes, by Age, Race, and Sex, United States, 2011 • Percentage of the population highest among persons aged 65 years and older • Percentage of population lowest among persons aged 45 years and younger • Decrease in Asian males from 65-74 compared to 75+ age group • Asian male and Black male in age group 65-74 http://www.cdc.gov/diabetes/statistics/prev/national/fig2004.htm
Prevalence of Diabetes Shown Globally for 2013 http://www.idf.org/worlddiabetesday/toolkit/gp/facts-figures
Incidence - Annual Number of New Cases of Diabetes in Adults 18-79 Years, United States, 1980-2011 • Number of adults with newly diagnosed diabetes has tripled from 493,000 to 1.5 million • Substantial increase from 1990s to 2006 • No significant change from 2006 to 2011 http://www.cdc.gov/diabetes/statistics/incidence/fig1.htm
Incidence of Diagnosed Diabetes per 1,000 Population Aged 18-79 Years, 1980-2011 • Ages 18-44, incidence increased from 1980-2003 • Ages 45-64, incidence fluctuated in 1980s and increase from 1990-2002 • Neither showed significant change between 2000-2011 • Ages 65-79, incidence significantly increased from 6.9 to 15.4 per 1000 in 2011 http://www.cdc.gov/diabetes/statistics/incidence/fig3.htm
Incidence of Diagnosed Diabetes per 1000 Population Aged 18-79 Years, by Sex, United States, 1980-2011 • Age-Adjusted incidence of diagnosed diabetes significantly increase for men and women • Incidence is twice as high in 2011 compared to 1980 • In 2011, the incidence was very similar (7.7 men vs 7.5 women) http://www.cdc.gov/diabetes/statistics/incidence/fig4.htm
Crude Incidence per 1,000 Population Aged 18-79 Years, by Sex and Age, United States, 1997-2011 • Incidence increased for all age groups among women • Incidence increased for men in age group 18-44 and 45-64 years • No significant change found in incidence for men aged 65-79 years http://www.cdc.gov/diabetes/statistics/incidence/fig5.htm
Incidence of Diabetes per 1,000 Population Aged 18-79 Years, by Race/Ethnicity, United States, 1997-2011 • Most increase during this time period was among blacks and Hispanics • For whites, most incidence increase during 1997-2007 • For whites, no significant change from 2007-2011 • In 2011 incidence of diagnosed diabetes was... • 12.4/1,000 in blacks • 11.1/1,000 in Hispanics • 7.0/1,000 in whites http://www.cdc.gov/diabetes/statistics/incidence/fig6.htm
Age-Adjusted Incidence per 1,000 Population Aged 18-79 Years, by Education, United States, 1980-2011 • Overall incidence during this time period has increase for all education levels • Higher incidence among people with less than a high school education • In 2011 • 11.6/1,000 for < high school education • 7.9/1,000 for high school equivalent • 6.6/1,000 for > high school education
Morbidity • 7 out of 10 deaths among Americans each year are from chronic diseases. • Heart disease, cancer and stroke account for more than 50% of all deaths each year. • Obesity has become a major health concern. 1 in every 3 adults is obese and almost 1 in 5 youth between the ages of 6 and 19 is obese (BMI ≥ 95th percentile of the CDC growth chart). • Arthritis is the most common cause of disability, with nearly 19 million Americans reporting activity limitations. • Diabetes continues to be the leading cause of kidney failure, nontraumatic lower-extremity amputations, and blindness among adults, aged 20-74. • Excessive alcohol consumption is the third leading preventable cause of death in the U.S., behind diet and physical activity and tobacco.
Morbidity: Diabetes Complications • Cardiovascular Disease (CVD): Heart Disease or Stroke (related to High Blood Pressure) • Diabetes Ketoacidosis (DKA) • End-Stage Renal Disease (ESRD) • Limitations in mobility • Visual impairments • Depression • Poor pregnancy outcomes
Age-Adjusted Percentage of Adults Aged 18 Years or Older with Diagnosed Diabetes Who Have Risk Factors for Complications, United States, 2010
CVD: Number (in Millions) of People with Diabetes Aged 35 Years or Older with Self-Reported Heart Disease or Stroke, 1997–2011 htt From 1997 to 2011, • 4.2 million to 7.6 million In 2011, • coronary heart disease - 5.0 million • other heart disease or condition - 3.7 million • stroke - 2.1 million http://www.cdc.gov/diabetes/statistics/complications_national.htm#1
Percentage of People with Diabetes Aged 35 Years or Older Reporting Heart Disease or Stroke, by Age and Sex, 1997–2011
DKA:Number (in Thousands) of Hospital Discharges with Diabetic Ketoacidosis as First-Listed Diagnosis, 1988–2009 http://www.cdc.gov/diabetes/statistics/dkafirst
Average Length of Stay in Days of Hospital Discharges with Diabetic Ketoacidosis as First-Listed Diagnosis, 1988–2009 Average Length of Stay (LOS) • decreased by 2.3 days • (from 5.7 to 3.4 days) • decreases seen among all age and race-sex groups
Age-Adjusted Hospital Discharge Rates for DKA as First-Listed Diagnosis per 1,000 Diabetic Population, by Race From 1988 to 2009, • declined rates among blacks vs whites (60.5% vs 45.0%) In 2009, • 14.3 per 1,000 whites with diagnosed diabetes vs 22.7 per 1,000 blacks with diagnosed diabetes
ESRD-DM: Crude and Age-Adjusted Incidence of ESRD-DM per 1,000,000 Population, 1980–2008 • Both crude and age-adjusted rates increased sharply from 1980s-1999 and slowed down • In 2008 • crude rate was 158.9 per 1,000,000 population vs age-adjusted rate 148.8 per 1,000,000 population
Crude and Age-Adjusted Incidence of (ESRD-DM) per 100,000 Diabetic Population, United States, 1980–2008 • Initiation of treatment for (ESRD-DM) per 100,000 diabetic population---increased from 1980 until mid-1990s, then decreased • ESRD-D incidence among persons with diagnosed diabetes has declined since 1996 • age-adjusted rate of ESRD-D among persons with diagnosed diabetes declined 35% overall, and declined in all U.S. regions and in most states.
Mobility: Age-Adjusted Percentage of Adults with Diagnosed Diabetes Reporting Mobility Limitation, by Task, 1997–2011 According to 2011 data, • 27.8%----climbing up 10 steps, • 36.6%---walking a quarter mile • 38.0%----standing for 2 hours, and • 44.3%----stooping, bending, or kneeling
Percentage of Adults with Diagnosed Diabetes Reporting Any Mobility Limitation, by Age, 1997–2011
Visual Impairment: Crude and Age-Adjusted Percentage of Adults Aged 18 Years or Older with Diagnosed Diabetes Reporting Visual Impairment, 1997–2011
Mortality:Hyperglycemic Crises In 2009, hyperglycemic crises caused ●2,417 deaths, ●vs 3,012 deaths (19.8% lower) in 1980 Number of Deaths for Hyperglycemic Crises as Underlying Cause, United States, 1980–2009
Death Rates for Hyperglycemic Crises as Underlying Cause per 100,000 Diabetic Population, By Age, 1980–2009
Value and Non-Value of Screening Type 1 Diabetes • Population screening NOT recommended • Why not? • infrequent occurrence of the disorder • short time between onset of hyperglycemia and the onset of symptoms in most patients (American Diabetes Association 2004)
Value and Non-Value of Screening Type 2 Diabetes • Selective screening IS recommended for defined high-risk groups • over 45 years old (every 3 years) • Native Americans, Hispanics, African Americans • strong family history of type 2 diabetes • BMI greater than 30 • with conditions including coronary heart disease, stroke, hypertension, hypertriglyceridemia, low HDL (American Diabetes Association 2004)
Value and Non-Value of Screening Gestational Diabetes • Population screening IS recommended for ALL pregnant women after 24 weeks (American Diabetes Association 2014, USPSTF 2014)
Screening Process • Fasting plasma glucose test • no food consumption for 8 hours prior • most reliable: two high readings on different days • Oral glucose tolerance test • used primarily in Gestational Diabetes screening • Random plasma glucose test • not sufficient for a diagnosis • must be used in conjunction with patient presenting typical symptoms
Financial Impact in the U.S. • Direct medical costs in 2007.........................$116 billion • Indirect medical costs in 2007.........................$58 billion • Total costs in 2007........................................$174 billion (American Diabetes Association 2008a) • Direct medical costs in 2012.........................$176 billion • Indirect medical costs in 2012.........................$69 billion • Total costs in 2012........................................$245 billion (American Diabetes Association 2013) Bottom Line: 41% increase in spending in 5 years
What are direct medical costs? (American Diabetes Association 2013)
What are indirect medical costs? (American Diabetes Association 2013)
Cost per Person per Year in the U.S. • Diagnosed with Diabetes..................$13,700 • Absence of Diabetes...........................$5,800 • Annual Cost of Diabetes per Person...$7,900 People with diagnosed diabetes have medical expenditures that are 2.3 times higherthan if they did not have diabetes. (American Diabetes Association 2013)
Financial Impact Data: Reliability and Validity • These estimates omit: • intangibles from pain and suffering • resources from care provided by non-paid caregivers • burden associated with undiagnosed diabetes So in reality, the true cost of diabetes is likely even higher than $245,000,000,000 per year.