Download
1 / 29
290 likes | 593 Views
Multi-label Relational Neighbor Classification using Social Context Features. Xi Wang and Gita Sukthankar Department of EECS University of Central Florida. Motivation. The conventional relational classification model focuses on the single-label classification problem.

E N D
Multi-label Relational Neighbor Classification using Social Context Features Xi Wang and Gita Sukthankar Department of EECS University of Central Florida
Motivation • The conventional relational classification model focuses on the single-label classification problem. • Real-world relational datasets contain instances associated with multiple labels. • Connections between instances in multi-label networks are driven by various casual reasons. Artificial Intelligence Data Mining Machine Learning Example: Scientific collaboration network
Problem Formulation • Node classification in multi-relational networks • Input: • Network structure (i.e., connectivity information) • Labels of some actors in the network • Output: • Labels of the other actors
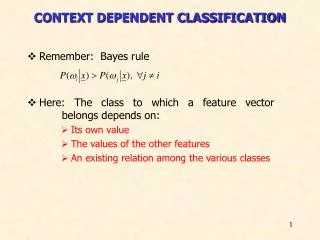
Classification in Networked Data • Homophily: nodes with similar labels are more likely to be connected • Markov assumption: • The label of one node depends on that of its immediate neighbors in the graph • Relational models are built based on the labels of neighbors. • Predictions are made using collective inference.
Contribution • A new multi-label iterative relational neighbor classifier (SCRN) • Extract social context features using edge clustering to represent a node’s potential group membership • Use of social features boosts classification performance overbenchmarks on several real-world collaborative networked datasets
Relational Neighbor Classifier • The Relational Neighbor (RN) classifier proposed by Macskassy et al. (MRDM’03), is a simple relational probabilistic model that makes predictions for a given node based solely on the class labels of its neighbors. Training Graph Iteration 2 Iteration 1
Relational Neighbor Classifier • Weighted-vote relational neighbor classifier (wvRN) estimates prediction probability as: Here is the usual normalization factor, and isthe weight of the link between node and
Apply RN in Multi-relational Network :nodes with both labels (red, green) : nodes with green label only : nodes with red label only Ground truth
Edge-Based Social Feature Extraction • Connections in human networks are mainly affiliation-driven. • Since each connection can often be regarded as principally resulting from one affiliation, links possess a strong correlation with a single affiliation class. • The edge class information is not readily available in most social media datasets, but an unsupervised clustering algorithm can be applied to partition the edges into disjoint sets(KDD’09,CIKM’09).
Clusteredges using K-Means • Scalable edge clustering method proposed by Tang et al. (CIKM’09). • Each edge isrepresentedin a feature-based format, where each edge is characterized by its adjacent nodes. • K-means clustering is used to separate the edges into groups, and the social feature (SF) vector is constructed based on edge cluster IDs. Originalnetwork Step1:Edgerepresentations Step2:Constructsocialfeatures
Edge-ClusteringVisualization Figure:Asubset of DBLP with 95 instances. Edges are clustered into 10 groups,with eachshown in a different color.
Proposed Method:SCRN • The initial set of reference features for class c can be defined as the weighted sum of social feature vectors for nodes known to be in class c: • Then node ’s class propagation probability for class c conditioned on its social features:
SCRN • SCRN estimates the class-membership probability of node belonging to class c using the following equation: classpropagationprobability similaritybetweenconnectednodes (link weight) classprobabilityofitsneighbors
SCRNOverview Input: , Max_Iter Output: for nodes in • Construct nodes’ social feature space • Initialize the class reference vectors for each class • Calculate the class-propagation probability for each test node • Repeat until # of iterations > Max_Iter or predictions converge • Estimate test node’s class probability • Update the test node’s class probability in collective inference • Update the class reference vectors • Re-calculate each node’s class-propagation probability
SCRNVisualization Figure:SCRN on syntheticmulti-labelnetworkwith1000nodes and 32 classes (15 iterations).
Datasets • DBLP • We construct a weighted collaboration network for authors who have published at least 2 papers during the 2000 to 2010 time- frame. • We selected 15 representative conferences in 6 research areas:
Datasets • IMDb • We extract movies and TV shows released between 2000 and 2010, and those directed by the same director are linked together. • We only retain movies and TV programs with greater than 5 links. • Each movie can be assigned to a subset of 27 different candidate movie genres in the database such as “Drama", “Comedy", “Documentary" and “Action”.
Datasets • YouTube • Asubset of data (15000 nodes) from the original YouTube dataset[1]usingsnowballsampling. • Each user in YouTube can subscribe to different interest groups and add other users as his/her contacts. • Classlabelsare47 interest groups. [1]http://www.public.asu.edu/~ltang9/social_ dimension.html
ComparativeMethods • Edge (EdgeCluster) • wvRN • Prior • Random
ExperimentSetting • Sizeofsocialfeaturespace: • 1000forDBLPandYouTube;10000forIMDb • Classpropagationprobabilityiscalculatedwith theGeneralizedHistogramIntersectionKernel. • Relaxation Labeling is used in the collective inference framework for SCRN and wvRN. • Weassumethenumberoflabelsfortestingnodesisknown.
Experiment Setting • We employ the network cross-validation (NCV) method (KAIS’11) to reduce the overlap between test samples. • Classificationperformanceisevaluatedbasedon Micro-F1, Macro-F1 and Hamming Loss.
Results (Micro-F1) • DBLP
Results (Macro-F1) • DBLP
Results (Hamming Loss) • DBLP
Results (Hamming Loss) • IMDb
Results (Hamming Loss) • YouTube
Conclusion • Links in multi-relational networks are heterogeneous. • SCRN exploits label homophily while simultaneously leveraging socialfeature similarity through the introduction of class propagation probabilities. • Significantly boosts classification performance on multi-labelcollaboration networks. • Our open-source implementation of SCRN is available at: http://code.google.com/p/multilabel-classification-on-social-network/
Reference • MACSKASSY, S. A., AND PROVOST, F. A simple relational classifier. In Proceedings of the Second Workshop on Multi-Relational Data Mining (MRDM) at KDD, 2003, pp. 64–76. • TANG, L., AND LIU, H. Relational learning via latent social dimensions. In Proceedings of the ACM SIGKDD International Conference on Knowledge Discovery and Data Mining(KDD), 2009, pp. 817–826. • TANG, L., AND LIU, H. Scalable learning of collective behavior based on sparse social dimensions. In Proceedings of International Conference on Information and Knowledge Management (CIKM), 2009, pp. 1107-1116. • NEVILLE, J., GALLAGHER, B., ELIASSI-RAD, T., AND WANG, T. Correcting evaluation bias of relational classifiers with network cross validation. Knowledge and Information Systems (KAIS), 2011, pp. 1–25.