Download

1 / 43
480 likes | 824 Views
Efficient Diversification. 6. Bodie, Kane and Marcus Essentials of Investments 9 th Global Edition. 6.1 Diversification and Portfolio Risk. Market/Systematic/Non diversifiable Risk Risk factors common to whole economy Unique/Firm-Specific/Nonsystematic/ Diversifiable Risk

E N D
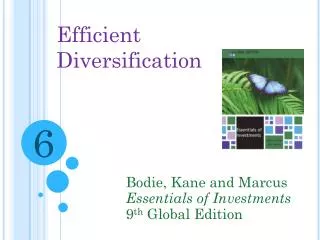
Efficient Diversification 6 Bodie, Kane and Marcus Essentials of Investments 9th Global Edition
6.1 Diversification and Portfolio Risk • Market/Systematic/Non diversifiable Risk • Risk factors common to whole economy • Unique/Firm-Specific/Nonsystematic/ Diversifiable Risk • Risk that can be eliminated by diversification
Figure 6.1 Risk as Function of Number of Stocks in Portfolio
6.2 Asset Allocation with Two Risky Assets • Covariance and Correlation • Portfolio risk depends on covariance between returns of assets • Expected return on two-security portfolio
6.2 Asset Allocation with Two Risky Assets Covariance Calculations Correlation Coefficient
6.2 Asset Allocation with Two Risky Assets • Using Historical Data • Variability/covariability change slowly over time • Use realized returns to estimate • Cannot estimate averages precisely • Focus for risk on deviations of returns from average value
6.2 Asset Allocation with Two Risky Assets • Three Rules • RoR: Weighted average of returns on components, with investment proportions as weights • ERR: Weighted average of expected returns on components, with portfolio proportions as weights • Variance of RoR:
6.2 Asset Allocation with Two Risky Assets • Risk-Return Trade-Off • Investment opportunity set • Available portfolio risk-return combinations • Mean-Variance Criterion • If E(rA) ≥ E(rB) and σA ≤ σB • Portfolio A dominates portfolio B
Figure 6.4 Opportunity Sets: Various Correlation Coefficients
6.3 The Optimal Risky Portfolio with a Risk-Free Asset • Slope of CAL is Sharpe Ratio of Risky Portfolio • Optimal Risky Portfolio • Best combination of risky and safe assets to form portfolio
6.3 The Optimal Risky Portfolio with a Risk-Free Asset • Calculating Optimal Risky Portfolio • Two risky assets
6.4 Efficient Diversification with Many Risky Assets • Efficient Frontier of Risky Assets • Graph representing set of portfolios that maximizes expected return at each level of portfolio risk • Three methods • Maximize risk premium for any level standard deviation • Minimize standard deviation for any level risk premium • Maximize Sharpe ratio for any standard deviation or risk premium
6.4 Efficient Diversification with Many Risky Assets • Choosing Optimal Risky Portfolio • Optimal portfolio CAL tangent to efficient frontier • Preferred Complete Portfolio and Separation Property • Separation property: implies portfolio choice, separated into two tasks • Determination of optimal risky portfolio • Personal choice of best mix of risky portfolio and risk-free asset
6.4 Efficient Diversification with Many Risky Assets • Optimal Risky Portfolio: Illustration • Efficiently diversified global portfolio using stock market indices of six countries • Standard deviation and correlation estimated from historical data • Risk premium forecast generated from fundamental analysis
6.5 A Single-Index Stock Market • Index model • Relates stock returns to returns on broad market index/firm-specific factors • Excess return • RoR in excess of risk-free rate • Beta • Sensitivity of security’s returns to market factor • Firm-specific or residual risk • Component of return variance independent of market factor • Alpha • Stock’s expected return beyond that induced by market index
6.5 A Single-Index Stock Market • Excess Return
6.5 A Single-Index Stock Market • Statistical and Graphical Representation of Single-Index Model • Security Characteristic Line (SCL) • Plot of security’s predicted excess return from excess return of market • Algebraic representation of regression line
6.5 A Single-Index Stock Market • Statistical and Graphical Representation of Single-Index Model • Ratio of systematic variance to total variance
6.5 A Single-Index Stock Market • Diversification in Single-Index Security Market • In portfolio of n securities with weights • In securities with nonsystematic risk • Nonsystematic portion of portfolio return • Portfolio nonsystematic variance
6.5 A Single-Index Stock Market • Using Security Analysis with Index Model • Information ratio • Ratio of alpha to standard deviation of residual • Active portfolio • Portfolio formed by optimally combining analyzed stocks
5) The standard deviation of the market-index portfolio is 15%. Stock A has a beta of 2.2 and a residual standard deviation of 25%. What would make for a larger increase in the stock’s variance: an increase of .2 in its beta or an increase of 3.84% (from 30% to 33%) in its residual standard deviation? An investor who currently holds the market-index portfolio decides to reduce the portfolio allocation to the market index to 90% and to invest 10% in stock A. Which of the changes in (a) will have a greater impact on the portfolio’s standard deviation?
20) Investors expect the market rate of return this year to be 10.5%. The expected rate of return on a stock with a beta of 1.3 is currently 13.65%. If the market return this year turns out to be 9%, how would you revise your expectation of the rate of return on the stock?
21. The following figure shows plots of monthly rates of return and the stock market for two stocks. Which stock is riskier to an investor currently holding her portfolio in a diversified portfolio of common stock? Which stock is riskier to an undiversified investor who puts all of his funds in only one of these stocks?