Download
1 / 22
220 likes | 372 Views
*. Service provider network interconnect planning made easy. *STaR = Switching, Transport and Routing. What is Network STaR ?. Network STaR is a software system designed from the ground-up to plan & optimize Fixed Network Interconnection and create least-cost routing for: i

E N D
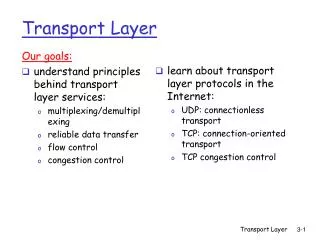
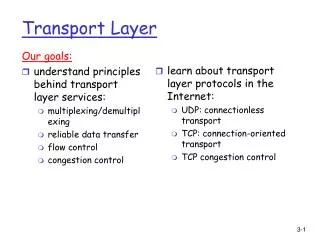
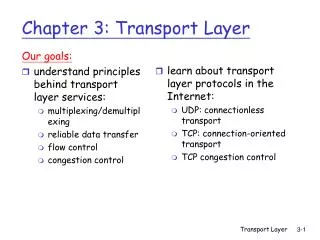
* Service provider network interconnect planning made easy. *STaR = Switching, Transport and Routing
What isNetwork STaR? Network STaRis a software system designed from the ground-up to plan & optimize Fixed Network Interconnectionand create least-cost routing for: i Public Switched Network Inter-Carrier Peering (IP) Inter-Market/LATA (IP) Core (Inter-Node) International Fixed Network Interconnection is a major operational expense.Network STaRcan reduce OPEX, increase utilization and reduce churn. RadioAccessNetwork (LTE) CoreNetwork(IP) FixedNetwork(TDM& IP)
The process flow forNetwork STaR: New projects are built with customer supplied data including network node info, trunk groups, core network details, TLDN ranges, Voice Mail details and several busy traffic days of Call Detail Records for Virtual Simulation purposes. Create New Project Start Accurate least-cost routing with up to 6 choices per route are automatically created for both Inter and Intra-MTA codes. The LERG™ Database as well as customer Business Rules are used. NPA/NXX/Kb tables are created “on the fly”. Auto-GenerateLeast-Cost Routing This is a “dress rehearsal” using the market’s actual CDR to exercise and fine-tune the new facilities and routing under realistic conditions. Traffic statistics are collected, errors are logged for resolution and Simulator CDR is output. Virtual Simulation Results of the last simulation are evaluated, errors are corrected and specialized tools are applied to further refine the network design. The tools include the Inter-Carrier Peering Tool, Inter-MTA VoIP Tool, Tandem Planner, DEOT Planner, LERG Tools, Geo Mapping System, etc. Analyze Results,Apply Tools &Make Modifications Exit when satisfiedwith design.
Inter-Carrier peering via VoIP reduces the cost of LEC tandem transit providing significant savings potential. Network STaRautomaticallycollects accurate traffic usage to all Intra-MTA carriers. The Financial Analysis tool with it’s adjustable parameters uses these statistics to predict future savings. The selected carriers are automatically provisioned in the Virtual Network Simulator. The Routing Design tool createsAccurate least-cost routing for the new (IP) trunk groups. Estimated Annual Savings by use of IP-Peering Adjustable Parameters
Using VoIP for Inter-Market traffic can create significant savings and is gaining wide popularity with service providers. Network STaR collects traffic usage to all MTAs (both on and off-net codes). The Financial Analysis tool uses adjustable parameters to predict future savings. Selected markets are automatically provisioned andleast-cost routing created. Estimated Annual Savings by use of Inter-MTA/Market VoIP Adjustable Parameters
The Network STaR visual Tandem Planning Tool makes it easy to select the most appropriate tandems. New tandem groups are automatically provisioned into the selected nodes and accurate least-cost routing is created to support them. Integrated Mapping makes it easy to visually identify and locate tandem locations in relation to network nodes. Selecting a tandem causes all associated codes to change from white to green, giving a visual indication of code coverage and holes in coverage. Codes that are outside the MTA are shown as well. Integrated Mapping
The Network STaR Direct End Office toolmakes suggestions for group augments or reductions. It also recommends new 2B direct routes as traffic approaches Interconnection Agreement minimum busy hour minutes requiring a new group. New groups are automatically provisioned and accurate least-cost routing created. GroupReductionSuggested New DEOTGroupSuggested GroupAugmentSuggested Adjustable Parameters AutomaticProvisioning inTrunk Groups
LERG™Database Using the LERG™ Database,the Routing Design system builds accurate least-cost routing tables that can be exported in any switch required format. It creates both inter-MTA and Intra-MTA routing, creating new NPA/NXX/Kb tables “on the fly” as required. Up to 6 route choices are accommodated.
The NPA/NXX/Kbtables can be viewed and the routing accuracy verified by simply clicking a Table Number. NPA info derived from the LERG™ is shown by clicking on the NPA. In this example, clicking the 310-202-5 entry brings up the Test Board, displaying both the LERG™ entry for the code and the actual routing in the simulator. This L.A. code is being properly routed on the Los Angeles direct VoIP route as first choice.
Finding the most economical mix of international carriers is greatly simplified with AZura. Using the native A-Z rate tables of prospectiveinternational carriers, AZura compares their cost benefit to the existing carrier mix to find new savings opportunities. The International Rating & Routing Engine in the Virtual Simulator uses native A-Z rate tables to accurately least-cost route all international traffic.
Virtual Network Simulation The ability to fine-tune and gauge the performance of a new network and routing design prior to deployment is unique to the Network STaR system. Using historic market CDR as call transactions, the Virtual Simulator routes and processes these calls, collecting traffic statistics and noting errors in it’s log. In this way, routing errors, facility shortcomings, missing trunk groups and other problems are found and corrected before they become customer service affecting. This screen shot of a simulation in progress shows 14,223 active calls, of which 3,949 are SIP. The call processing rate is about 2,100 calls per second and 3,203,555 calls have been successfully completed thus far.
Trunk Groups Each node has it’s own trunk group table, and trunk groups can be TDM or IP (SIP). Highlighted groups have reached a specified overflow value. Clicking a group name brings up the 24 hour display. Groups can be manually added or deleted as required.(in most cases groups are automatically provisioned. 24 Hour traffic statistics are collected for every group.
Pressing the “Actives” button during a simulation creates a snapshot of all calls existing at that moment. Sampling Routing Accuracy: Clicking on a Dialed Number pulls a Test Board display. Clicking on the Network Switch pulls the source CDR record. In this example we clicked on dialed # 708-410-3999. The LERG™ indicates this is a Nextel Intra-MTA code in Northbrook, Illinois which is being properly routed on the direct Nextel Peering (IP) group as first choice.
The Virtual Simulator creates it’s own CDRs as calls are completed. These CDRs can be selectively captured and viewed during active simulations to determine how specific call transactions are being processed. In this example, the originating subscriber is in the SCH3 node and dials a code that uses a Direct End Office trunk group in the BUR3 node. The A Leg is an inter-node (IMT) group between SCH3 and BUR3. The B Leg is the outgoing PSTN connection to the LCPTILLPDS0 LEC central office.
The Pre-Translator The Pre-Translator (Pre-XL) is a part of the simulator’s call processing process. It analyzes and parses dialed digits for special routing situations such as 0, 0+, X11, 8XX and market specific custom routing. For example, in the Pre-XL shown below, the non-existent 511 NXX is being used in specific NPAs to route to a company PBX. Also 4 digit calls that start with 2 through 8 also route to the same company PBX. There is a specific Pre-XL for each node. It is easy edited with a standard text editor and is loaded into the simulator along with other tables.
LERG™ Code Analysis Tool The LERG™ Database controls the routing of codes in North America by pointing code traffic to a specific network switch CLLI. In a wireless network with multiple nodes, the goal is to point each code to the node that receives the most traffic thus minimizing the required inter-node bandwidth. The Code Analysis Tool points out poor routing situations in the LERG™ and suggests the best alternative. In the example below, the 630-244 code currently points to the BFG1 node for 189 calls. This code should point to SCH3 which received 5248 calls.
Tandem Interconnection & other data LERG™ Integration Examples: Switch CLLI Information Codes owned by this CLLI Integrated Mapping
LERG™ Integrated Mapping Market Rate Centers Cell Sites Switch CLLIs Tandems
SpecializedLERG™ Tools Find the closest connection points between two service provider networks. See which carriers “live” in which buildings or carrier hotels by street address. Find switch entities with specific features, equipment, etc. Perform Erlang B traffic calculations.
Thanks for taking the time toview the benefits of… For more information contact: Brentwood Communications O.S.S. GroupNorm Zimon / 1-310-499-0000www.bwoss.com / www.bwoss.com LERG™ is a trademark of Telcordia Technologies