Download
1 / 43
430 likes | 657 Views
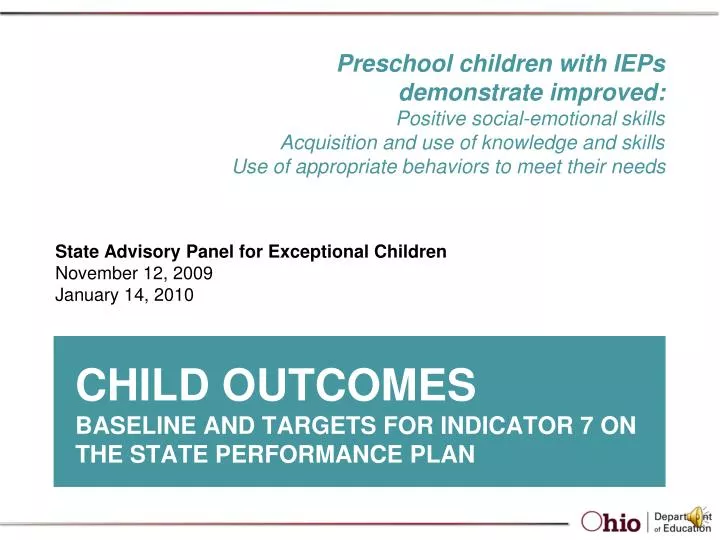
Preschool children with IEPs demonstrate improved: Positive social-emotional skills Acquisition and use of knowledge and skills Use of appropriate behaviors to meet their needs. State Advisory Panel for Exceptional Children November 12, 2009 January 14, 2010.

E N D
Preschool children with IEPs demonstrate improved:Positive social-emotional skillsAcquisition and use of knowledge and skillsUse of appropriate behaviors to meet their needs State Advisory Panel for Exceptional Children November 12, 2009 January 14, 2010 Child OutcomesBaseline and Targets for Indicator 7 on the State Performance Plan
Outcomes • Accountability framework • Partnership project • OSEP categories – a review • Summary statements and calculations • Local reports • Data errors • Program evaluation analysis • Baseline/targets
Where does this performance measure fit in the big picture? ACCOUNTABILITY
Accountability FrameworkEarly Childhood Child and Family Outcome Measures Aligned with P-12 Content Standards ProgramCapacity Measures Curriculum-Embedded Performance Measures
Accountability FrameworkEarly Childhood Child and Family Outcome Measures Literacy: GGG and KRA-L Early Childhood Outcomes Summary Parent Survey Health and Developmental Screenings Aligned with P-12 Content Standards Program Capacity Measures Curriculum-Embedded Performance Measures ELLCO: Early Language and Literacy Classroom Observation ELLRT: Early Language and Literacy Reflection Tool Self-Assessment Tools Tools for Alignment to the Early Learning Content Standards IEP Outcomes
Child Outcomes • Preschool children with IEPs demonstrate improved: • Positive social-emotional skills • Acquisition and use of knowledge and skills • Use of appropriate behaviors to meet their needs
Early Childhood Outcomes Center • OSEP-funded technical assistance project • Developed three summary measures • Developed summary form for reporting • 38 out of 59 states/territories using this form • Developed crosswalk translating entry/exit scores to OSEP categories • Developed summary statements reported in Annual Performance Report (APR) • Analyzes all APRs submitted annually and provides summary report
Early Childhood Outcomes Center • Ohio one of seven partner states (competitive application) to develop accountability framework for this indicator • ECO Center – specific work with Ohio • Analysis of outcomes data • Professional development on data accuracy and quality • Measurement scale appropriate for use across public preschool and special education • Recommendations for data collection
The Basics of Quality Data and Target Setting Early Childhood Outcomes (ECO) Center National Early Childhood Technical Assistance Center (NECTAC) Workshop 1: December 5, 2009
Goal of Early Intervention/Early Childhood Special Education To enable young children to be active and successful participants during the early childhood years and in the future in a variety of settings – in their homes with their families, in child care, in preschool or school programs, and in the community. Early Childhood Outcomes Center, http://www.fpg.unc.edu/~eco/pdfs/eco_outcomes_4-13-05.pdf
Child Outcomes Outcome 1: Positive social emotional skills (including positive social relationships) The intended meaning: Using social/emotional, language, cognitive (etc.) skills to have positive social relationships Early Childhood Outcomes Center
Child Outcomes Outcome 2: Acquisition and use of knowledge and skills (including early language/ communication [and early literacy]) The intended meaning: Using cognitive, language (etc.) skills to reason, problem solve and understand their physical and social worlds Early Childhood Outcomes Center
Child Outcomes Outcome 3: Use of appropriate behaviors to meet their needs The intended meaning: Using motor, language, social, cognitive (etc.) skills to successfully take care of themselves and their needs Early Childhood Outcomes Center
OSEP Reporting Categories Percentage of children who: a. Did not improve functioning b. Improved functioning, but not sufficient to move nearer to functioning comparable to same-aged peers c. Improved functioning to level nearer to same-aged peers but did not reach it d. Improved functioning to reach level comparable to same-aged peers • Maintained functioning at level comparable to same-aged peers Early Childhood Outcomes Center
Key Concepts Related to Progress Categories • Progress categories require two data points for each child • Based on growth trajectories • Compare child to himself or herself over time • Compares each child to age expectations Early Childhood Outcomes Center
The “a” Category a. Percent of Part C/preschool children who did not improve functioning • Children who acquired no new skills or regressed during their time in the program • Didn’t gain or use even one new skill Children with degenerative conditions/ significant disabilities Early Childhood Outcomes Center
Entry Exit
Entry Exit
The “b” Category b. Percent of Part C/preschool children who improved functioning but not sufficient to move nearer to functioning comparable to same-aged peers • Children who acquired new skills but continued to grow at same rate throughout their time in program • Gained and used new skills but did not increase their rate of growth or change their growth trajectories while in services Early Childhood Outcomes Center
Entry Exit
Exit Entry
Entry Exit
The “c” Category c. Percent of Part C/preschool children who improved functioning to level nearer to same-aged peers but did not reach it • Children who acquired new skills but accelerated their rate of growth during their time in program • Made progress toward catching up with same aged peers but were still functioning below age expectations when they left program • Changed growth trajectories – “narrowed the gap” Early Childhood Outcomes Center
Entry Exit
The “d” Category d. Percent of preschool children who improved functioning to reach level comparable to same-aged peers • Children who were functioning below age expectations when they entered program but were functioning at age expectations when they left • Started out below age expectations, but caught up while in services Early Childhood Outcomes Center
Entry Exit
The “e” Category e. Percent of Part C/preschool children who maintained functioning at level comparable to same-aged peers • Children who were functioning at age expectations when they entered program and were functioning at age expectations when they left • Entered program at age expectations and were still up with age expectations at exit Early Childhood Outcomes Center
Entry Exit
Entry Exit
Summary Statement Data Required Summary Statement 1: Of those children who entered or exited program below age expectations in each Outcome, percent who substantially increased their rate of growth by time they exited program. Required Summary Statement 2: Percent of children who were functioning within age expectations in each Outcome by time they exited program. Early Childhood Outcomes Center
Summary Statement 1 359 (a, b, c and d) or 46 percent of children entered or exited program functioning below age expectations 425 (e) or 54 percent of children entered and exited functioning at age expectations
Percent of Children Who Made Greater than Expected Progress 236 (c and d) of 359 (a, b, c, and d) changed growth trajectories (made greater than expected progress) 236 359 = 66%
Percent Who Exited at Age Expectations 22 percent of children reached age expectations by exit and 54 percent of children entered and exited at age expectations 169 + 425 784 = 76%
Data, Evidence, Results • Usually they are what they are • Not debatable
Inference, Interpretation But what do data mean? Good news? Bad news? Debatable – even reasonable people can reach different conclusions May be question of data quality To reach an inference, sometimes analyze data in other ways (ask for more evidence)
Action Given interpretation of evidence, what should be done? Recommendations or action steps Action can be debatable – and often is Again, sometimes action is to improve quality of data
Indicator 7: Early Childhood OutcomesSAPEC November 2009 Baseline and Targets – Re-AnalysisRe-analysis of data changes baseline and proposed new targets. Revised information for SAPEC consideration and approval during January 2010 meeting. This data in February 2010 APR.
Outcome 1 Outcome 2 Outcome 3