Download
1 / 38
380 likes | 451 Views
Wisconsin's Children Moving Forward. Indicator 7 Child Outcomes MAKING SENSE OF THE DATA June 2010. Indicator #7 – Child Outcomes. Percent of preschool children with IEPs who demonstrate improved: Social -emotional skills (including social relationships)

E N D
Wisconsin's Children Moving Forward Indicator 7 Child Outcomes MAKING SENSE OF THE DATA June 2010
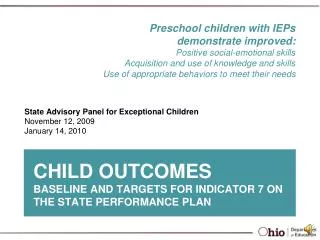
Indicator #7 – Child Outcomes Percent of preschool children with IEPs who demonstrate improved: • Social-emotional skills (including social relationships) • Acquisition and use of knowledge and skills (including early language/communication and early literacy) • Use of appropriate behaviors to meet their needs
What Happens to the Data? From Entry/Exit Ratings to Summary Statement Percentages
The 7-Point Entry/Exit Rating Scale Definitions Rating Scale: 1 Child does not yet show functioning expected of a child his or her age in any situation. Child’s functioning does not yet include immediate foundational skills upon which to build age- appropriate functioning. Child’s functioning reflects skills that developmentally come before immediate foundational skills. Child’s functioning might be described as like that of a much younger child.
The 7-Point Entry/Exit Rating Scale Definitions Rating Scale: 2 Child occasionally uses immediate foundational skills across settings and situations. More functioning reflects skills that are not immediate foundational than are immediately foundational.
The 7-Point Entry/Exit Rating Scale Definitions Rating Scale: 3 Child does not yet show functioning expected of a child of his or her age in any situation. Child uses immediate foundational skills, most or all of the time, across settings and situations. Immediate foundational skills are the skills upon which to build age-appropriate functioning. Functioning might be described as like that of a younger child.
The 7-Point Entry/Exit Rating Scale Definitions Rating Scale: 4 Child shows occasional age-appropriate functioning across settings and situations. More functioning is not age-appropriate than age-appropriate.
The 7-Point Entry/Exit Rating Scale Definitions Rating Scale: 5 Child shows functioning expected for his or her age some of the time and/or in some settings and situations. Child’s functioning is a mix of age-appropriate and not age-appropriate behaviors and skills. Child’s functioning might be described as like that of a slightly younger child.
The 7-Point Entry/Exit Rating Scale continued Rating Scale: 6 Child’s functioning generally is considered appropriate for his or her age but there are some significant concerns about the child’s functioning in this outcome area. These concerns are substantial enough to suggest monitoring or possible additional support. Although age-appropriate, the child’s functioning may border on not keeping pace with age expectations.
The 7-Point Entry/Exit Rating Scale continued Rating Scale: 7 Child shows functioning expected for his or her age in all or almost all everyday situations that are part of the child’s life. Functioning is considered appropriate for his or her age. No one has any concerns about the child’s functioning in this outcome area.
5 Progress Categories for Child Outcomes Percent of preschool children who: a. Did not improve functioning b. Improved functioning, but not sufficient to move nearer to functioning comparable to same-aged peers c. Improved functioning to a level nearer to same-aged peers but did not reach it d. Improved functioning to reach a level comparable to same-aged peers e. Maintained functioning at a level comparable to same-aged peers
Key Points in Calculation of Progress Categories The progress categories describe types of progress children can make between entry and exit Two COSF ratings (entry and exit) are needed to calculate the child’s progress category Calculation of progress categories happens at the state level
Progress Category “a” a. Percent of preschool children who did not improve functioning • Children who acquired no new skills and regressed during their time in the program • Children who did not gain or use even one new skill • Children with degenerative conditions/significant disabilities
Entry Exit
Entry Exit
Progress Category “b” b. Percent of preschool children who improved functioning but not sufficient to move nearer to functioning comparable to same-aged peers • Children who acquired new skills but continued to grow at the same rate throughout their time in the program • Children who gained and used new skills but did not increase their rate of growth or change their growth trajectories while in services
Entry Exit
Entry Exit
Progress Category “c” c. Percent of preschool children who improved functioning to a level nearer to same-aged peers but did not reach it • Children who acquired new skills and accelerated their rate of growth during their time in the program • Children who made progress toward catching up with same-aged peers but were still functioning below age expectations when they left the program • Children who changed their growth trajectories --“narrowed the gap”
Entry Exit
Progress Category “d” d. Percent of preschool children who improved functioning to reach a level comparable to same-aged peers • Children who were functioning below age expectations when they entered the program but were functioning at age expectations when they left
Entry Exit
Progress Category “e” e. Percent of preschool children who maintained functioning at a level comparable to same-aged peers • Children who were functioning at age expectations when they entered the program and were functioning at age expectations when they left
Entry Exit
Entry Exit
Outcome #1 Comparison with National DataPositive social -motional skills (including social relationships)
Outcome #2 Comparison with National DataAcquisition and use of knowledge and skills (including early language/communication and early literacy)
Outcome #3 Comparison with National DataUse of appropriate behaviors to meet their needs
The Summary Statements • Of those preschool children who entered the preschool program below age expectations in each Outcome, the percent of those preschool children who substantially increased their rate of growth by the time they turned 6 years of age or exited the program. • The percent of preschool children who were functioning within age expectations in each Outcome by the time they turned 6 years of age or exited the program.
What Does This Mean for Outcome #1 – Positive Social-Emotional Skills? Summary Statement 1 Of those preschool children who entered the preschool program below age expectations in Outcome #1, 79.0% substantially increased their rate of growth by the time they turned 6 years of age or exited the program. Summary Statement 2 69.5% of preschool children were functioning within age expectations in Outcome #1 by the time they turned 6 years of age or exited the program.
What Does This Mean for Outcome #2 – Acquiring & Using Knowledge & Skills? Summary Statement 1 Of those preschool children who entered the preschool program below age expectations in Outcome #2, 81.9% substantially increased their rate of growth by the time they turned 6 years of age or exited the program. Summary Statement 2 61.7% of preschool children were functioning within age expectations in Outcome #2 by the time they turned 6 years of age or exited the program.
What Does This Mean for Outcome #3 – Using Appropriate Behavior to Meet Needs? Summary Statement 1 Of those preschool children who entered the preschool program below age expectations in Outcome #3, 81.8% substantially increased their rate of growth by the time they turned 6 years of age or exited the program. Summary Statement 2 80.3% of preschool children were functioning within age expectations in Outcome #3 by the time they turned 6 years of age or exited the program.
Essential Knowledge to Improve Data Quality COSF team members must… Know about the child’s functioning across settings and situations Understand age-expected child development Understand the content of the three child outcomes Know how to use the rating scale Use the Decision Tree in the rating process Understand age expectations for child functioning within the child’s culture
Quality Indicators of a Good COSF Discussion All team members participate Parent input is respectfully considered Multiple sources of assessment information considered (observation, family report, formal “testing”) Team describes child’s functioning (not just test scores) Discussion includes child’s full range of functioning Team documents the rationale for the rating