Download
1 / 16
170 likes | 291 Views
The General LISREL MODEL and Non-normality. Ulf H. Olsson Professor of Statistics. Branch. Loan. Satisfaction. Loyalty. Savings. The General LISREL model. Syntax. DA NI=? NO=??? MA=CM CM FI=?????.cov MO NX=? NY=?? NK=? NE=? BE=FU,FI PA LX 1 0 0 Etc… PA LY 1 0 1 0 Etc… FR……

E N D
The General LISREL MODELand Non-normality Ulf H. Olsson Professor of Statistics
Branch Loan Satisfaction Loyalty Savings The General LISREL model Ulf H. Olsson
Syntax • DA NI=? NO=??? MA=CM • CM FI=?????.cov • MO NX=? NY=?? NK=? NE=? BE=FU,FI • PA LX • 1 0 0 • Etc… • PA LY • 1 0 • 1 0 • Etc… • FR…… • FI ….. • pd • ou Ulf H. Olsson
Bivariate normal distribution Ulf H. Olsson
Positive vs. Negative SkewnessExhibit 1 These graphs illustrate the notion of skewness. Both PDFs have the same expectation and variance. The one on the left is positively skewed. The one on the right is negatively skewed. Ulf H. Olsson
Low vs. High KurtosisExhibit 1 These graphs illustrate the notion of kurtosis. The PDF on the right has higher kurtosis than the PDF on the left. It is more peaked at the center, and it has fatter tails. Ulf H. Olsson
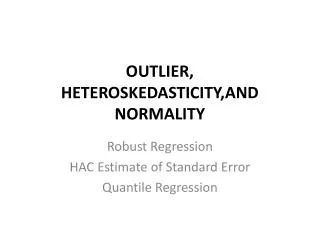
Non-normality (Interval Scale continuous variables) • Skewness • Kurtosis Ulf H. Olsson
Making Numbers S: sample covariance θ: parameter vector σ(θ): model implied covariance Ulf H. Olsson
Making Numbers Ulf H. Olsson
Making Numbers Ulf H. Olsson
Making Numbers Ulf H. Olsson
Making Numbers Ulf H. Olsson
Making Numbers Generally Ulf H. Olsson
ESTIMATORS • Maximum Likelihood (ML) • NWLS • RML • Generalized Least Squares (GLS) • Asymptotic Distribution Free (ADF) • Diagonally Weighted Least Squares(DWLS) • Unweighted Least Squares(ULS) Ulf H. Olsson
ESTIMATORS • If the data are continuous and approximately follow a multivariate Normal distribution, then the Method of Maximum Likelihood is recommended. • If the data are continuous and approximately do not follow a multivariate Normal distribution and the sample size is not large, then the Robust Maximum Likelihood Method is recommended. This method will require an estimate of the asymptotic covariance matrix of the sample variances and covariances. • If the data are ordinal, categorical or mixed, then the Diagonally Weighted Least Squares (DWLS) method for Polychoric correlation matrices is recommended. This method will require an estimate of the asymptotic covariance matrix of the sample correlations. Ulf H. Olsson
Estimation • 1) No AC provided • ML, GLS or ULS • 2) AC provided • ML • WLS (ADF) • DWLS Ulf H. Olsson