Download
1 / 25
270 likes | 361 Views
Phonon spectrum measured in a 1D Yukawa chain. John Goree & Bin Liu. Modes in 1-D chains. Colloids: Polymer microspheres trapped by counter-propagating laser beams Lowest-order modes (sloshing & breathing modes) observed experimentally. Carbon nanotubes: Xe atoms trapped on a tube

E N D
Phonon spectrum measured in a 1D Yukawa chain John Goree & Bin Liu
Modes in 1-D chains • Colloids: • Polymer microspheres trapped by counter-propagating laser beams • Lowest-order modes (sloshing & breathing modes) observed experimentally • Carbon nanotubes: • Xe atoms trapped on a tube • Theory: phonon spectrum Tatarkova, et al., PRL 2002 Cvitas and Siber, PRB 2003
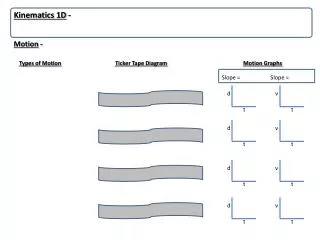
Modes in a 1-D chain Longitudinal mode • Transverse mode
Experimental system: dusty plasma • Like a colloidal suspension: • polymer microspheres • electrically charged • suspended in medium that provides screening • colloidal crystals • optical methods include: • direct imaging of particles • laser manipulation
Experimental system: dusty plasma • The medium is a plasma: • a low-pressure gas • partially ionized by applying high voltage
Experimental system: dusty plasma What’s special about plasma: • Medium is low density: • gas instead of a solvent • microspheres are underdamped • Suspension is very soft: • shear modulus of a 3D crystal is ´1019 smaller,as compared to metals • Temperature can be varied: • not in this talk
Microspheres • Melamine formaldehyde • diameter 8.09 mm • introduced into plasma by shaking a dispenser
In this experiment: • charge Q - 7600 e • screeninglength lD 0.86 mm • spacing a 0.80 mm } >> particle radius 4 mm Pair potential Particles suspended as a monolayer interact with a repulsive Yukawa potential:
Suspension of Microspheres • Microspheres: • have no buoyancy • levitated by electric field a few mm above electrode substrate • form horizontal monolayer • no out-of-plane buckling is observed • ordered lattice QE mg electrode substrate
Setup: Ar laser beam 1
Microspheres are trapped above the groove resonant frequency 0.1 Hz 3 Hz groove 15 Hz “Channel” on substrate to confine a chain Groove-shaped channel in lower electrode shapes the E field that confines particles
particle’s x,y position measured in each video frame Image of chain in experiment
incident laser beam momentum imparted to microsphere Vibrational Excitation • Elastic vibrations can be excited by: • Brownian motion in gas • Laser manipulation
1 mm Experiment:Natural motion of a 1-D chain (no manipulation) central portion of a 28-particle chain
Measuring phonon spectrum • Method: • Video microscopy • Particle tracking Þx(t) & v(t): • Calculate current correlation function C(q,t) • Fourier transform ÞC(q,w)
Phonon spectrum Color corresponds to energy Energy is concentrated in a band that corresponds to a dispersion relation Symbols indicate peaks
Phonon spectrum Color corresponds to energy Energy is concentrated in a band that corresponds to a dispersion relation Symbols indicate peaks
modulated beam 1 mm -I0 ( 1 + sint ) continuous beam I0 Excitation with laser manipulation Net force µI0 sint Wave propagates to two ends of chain
longitudinal transverse N = 28 N = 28 ○ excited Ñ natural ○ excited Ñ natural Dispersion relation - natural & externally excited
Summary • We used direct imaging to observe particle motion in a 1-D chain • We characterized the phonons by: • Power spectra • Dispersion relation • More details & theory: • Liu, Avinash & Goree PRL 2003 • Liu & Goree PRE 2005
Modulating the laser power scanning mirror Ar laser beam
Argon laser beam Argon laser beam Experiment result • wave: • is excited in the middle of chain • propagates to two ends of chain
Thermal motion Gas temperature = room temperature Particle kinetic temperature was computed from particle velocities 230 K from mean kinetic energy: 390K from fit of velocity distribution function: