Download
1 / 27
270 likes | 332 Views
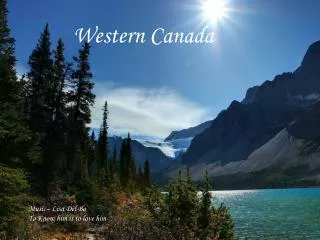
GCM based high resolution spatial temporal precipitation scenarios for western Canada. CCAF Funding through 03/2005. Investigators. Dr. James Byrne , University of Lethbridge Dr. Dan Johnson , AAFC Research Centre Dr. Alain Pietroniro , P.Eng., NHRC Suzan Lapp, University of Lethbridge

E N D
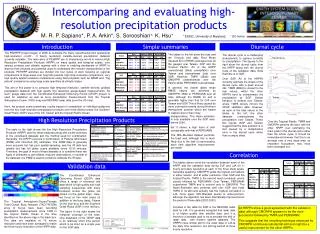
GCM based high resolution spatial temporal precipitation scenarios for western Canada CCAF Funding through 03/2005
Investigators • Dr. James Byrne, University of Lethbridge • Dr. Dan Johnson, AAFC Research Centre • Dr. Alain Pietroniro, P.Eng., NHRC • Suzan Lapp, University of Lethbridge • Nicole Rabe, University of Lethbridge • Nicole McKechnie, University of Lethbridge
Background • Global warming 1.4 to 5.8 C in this century • Warming most pronounced in winter (IPCC, 2001). • Alberta - Ralph Klein
Introduction • Surface water supplies = f (winter precip) • How will alpine winter precip change under climate warming?????
Problem?? • Snow-runoff ratios >> rainfall-runoff ratios • Shorter warmer winter = less snow, more rain • Result = declining water supplies??
Research Focus • Fall, winter, spring precip is a function of Synoptic circulation • Local historical precipitation statistics may be closely related to synoptic pattern statistics
Objectives • Apply synoptic downscaling techniques to develop and evaluate western Canadian precipitation scenarios based on a number of GCMs • Scenarios will be defined for all climate stations with meaningful (30 years) of climate data • Produce scenario databases for application by the global warming vulnerability, impacts and adaptation research community
Building on Lapp et al 2002; in review; Byrne et al, 1999. • Daily vs seasonal synoptic analysis • Synoptic • Persistence • Efficacy relative to precipitation
Synoptic Downscaling Synoptic downscaling DR SWS SWT SWC NWZ NWM NWW Changnon et al (1993)
Hydromet Model Simulates daily T, Td, Rad, Precip for any size grid over basin (used 100x100 metres)
1xCO2 2xCO2 How will winter runoff alter water quality?
Oldman Basin spring snow water equivalent declines 40% by 2020-50
Historical Scenarios Database • Visual Synoptic classification • 1961-1990 NCEP/NCAR six hourly historical upper air data • Window is 15-80N and 60-160W • Grid size of 2.5 x 2.5 degrees • 500 mb surfaces for Oct-March • Classified according to Changnon et al. (1993).
Cutoff (SWC) Jan 17/79 100m contour interval - Blue is low / Red is high
Meridional northwest (NWM) Jan 30/65 100m contour interval - Blue is low / Red is high
Trough (SWT) Feb 13/65 100m contour interval - Blue is low / Red is high
Ridge (DR) Feb 2/81 100m contour interval - Blue is low / Red is high
GC Models - upper air data • Canadian Centre for Climate Modelling and Analysis’ CGCM2 • Hadley Centre for Climate Prediction and Research’s HADCM3
Historical Precipitation Database • Global Daily database which includes 4584 stations in Canada • Select stations for • 30+ year records • good spatial distributions • NCDC Summary of the day (1867-2001) more than 19 000 stations throughout US
Methodology • Fall, winter and spring (FWS) precipitation is synoptically driven • Analyses as published • Byrne et al 1999 WRR 35:3793-3802 • Lapp et al 2002 IJOC 22:1807–1817
Methodology • Summer (S) – precipitation likely depends on spring soil water status • Wet spring soil = increased convective activity • Dry spring soil = decreased convective activity • Summer = mid-June to August
Deliverables • Monthly and daily precipitation database for all stations with meaningful (30 years) of climate data in western Canada; • Gridded monthly database @ 50 km resolution for the prairies; • High-resolution (1 km or less) daily data for regions under study with collaborators (Pietroniro, Gan, Herrington) and others.
References • Byrne, J.M., A. Berg and I. Townshend, 1999. Linking observed and GCM upper air circulation patterns to current and future snow runoff for the Rocky Mountains. Water Resources Research: 35, 3793-3802. • Changnon, D., McKee, T.B. and Doesken, N.J., 1993. Annual snowpack patterns across the Rockies: long-term trends and associated 500mb synoptic patterns. Mon. Wea. Rev., 121, 633-647. • Doty, BE, and J.L. Kinter III, 1995. Geophysical Data Analysis and Visualization using the Grid Analysis and Display system (GrADS). In Visualization techniques in Space and Atmospheric Sciences, Eds. E.P. Szuszczewicz and J.H. Bredekamp, Chp 3: Lower Atmosphere and Earth Science Application, pp.209-217. • IPCC, 2001. Summary for Policy Makers: a Report of Working Group I of the Intergovernmental Panel on Climate Change. • Lapp, S., J. Byrne, S. Kienzle and I. Townshend, 2002. Linking Global Circulation Model synoptics and precipitation for western North America. Int. J. Climatol. 22: 1807–1817. • Lapp, Suzan, James Byrne, Ivan Townshend and Stefan Kienzle. Climate Warming Impacts on Snowpack Accumulation in an Alpine Watershed: A GIS Based Modeling Approach. Int. J. Climatol., under review.