Download
1 / 25
250 likes | 340 Views
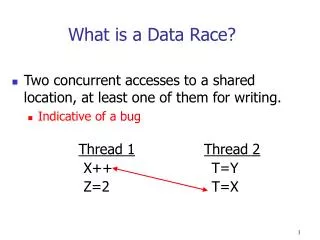
What is a Data Race?. Two concurrent accesses to a shared location, at least one of them for writing. Indicative of a bug. Thread 1 Thread 2 X++ T=Y Z=2 T=X. How Can Data Races be Prevented?. Explicit synchronization between threads: Locks Critical Sections Barriers Mutexes

E N D
What is a Data Race? • Two concurrent accesses to a shared location, at least one of them for writing. • Indicative of a bug Thread 1Thread 2 X++ T=Y Z=2 T=X
How Can Data Races be Prevented? • Explicit synchronization between threads: • Locks • Critical Sections • Barriers • Mutexes • Semaphores • Monitors • Events • Etc. Lock(m) Unlock(m)Lock(m) Unlock(m) Thread 1Thread 2 X++ T=X
Is This Sufficient? • Yes! • No! • Programmer dependent • Correctness – programmer may forget to synch • Need tools to detect data races • Expensive • Efficiency – to achieve correctness, programmer may overdo. • Need tools to remove excessive synch’s
Where is Waldo? #define N 100 Type g_stack = new Type[N]; int g_counter = 0; Lock g_lock; void push( Type& obj ){lock(g_lock);...unlock(g_lock);} void pop( Type& obj ) {lock(g_lock);...unlock(g_lock);} void popAll( ) { lock(g_lock); delete[] g_stack; g_stack = new Type[N]; g_counter = 0; unlock(g_lock); } int find( Type& obj, int number ) { lock(g_lock); for (int i = 0; i < number; i++) if (obj == g_stack[i]) break; // Found!!! if (i == number) i = -1; // Not found… Return -1 to caller unlock(g_lock); return i; } int find( Type& obj ) { return find( obj, g_counter ); }
Can You Find the Race? Similar problem was found in java.util.Vector #define N 100 Type g_stack = new Type[N]; int g_counter = 0; Lock g_lock; void push( Type& obj ){lock(g_lock);...unlock(g_lock);} void pop( Type& obj ) {lock(g_lock);...unlock(g_lock);} void popAll( ) { lock(g_lock); delete[] g_stack; g_stack = new Type[N]; g_counter = 0; unlock(g_lock); } int find( Type& obj, int number ) { lock(g_lock); for (int i = 0; i < number; i++) if (obj == g_stack[i]) break; // Found!!! if (i == number) i = -1; // Not found… Return -1 to caller unlock(g_lock); return i; } int find( Type& obj ) { return find( obj, g_counter ); } write read
Detecting Data Races? • NP-hard [Netzer&Miller 1990] • Input size = # instructions performed • Even for 3 threads only • Even with no loops/recursion • Execution orders/scheduling (#threads)thread_length • # inputs • Detection-code’s side-effects • Weak memory, instruction reorder, atomicity
Motivation Run-time framework goals • Collect a complete trace of a program’s user-mode execution • Keep the tracing overhead for both space and time low • Re-simulate the traced execution deterministically based on the collected trace with full fidelity down to the instruction level • Full fidelity: user mode only, no tracing of kernel, only user-mode I/O callbacks Advantages • Complete program trace that can be analyzed from multiple perspectives (replay analyzers: debuggers, locality, etc) • Trace can be collected on one machine and re-played on other machines (or perform live analysis by streaming) Challenges: Trace Size and Performance
Original Record-Replay Approaches • InstantReplay ’87 • Record order or memory accesses • overhead may affect program behavior • RecPlay ’00 • Record only synchronizations • Not deterministic if have data races • Netzer ’93 • Record optimal trace • too expensive to keep track of all memory locations • Bacon & Goldstein ’91 • Record memory bus transactions with hardware • high logging bandwidth
Motivation Increasing use and development for multi-core processors • MT program behavior is non-deterministic • To effectively debug software, developers must be able to replay executions that exhibit concurrency bugs • Shared memory updates happen in different order
Related Concepts • Runtime interpretation/translation of binary instructions • Requires no static instrumentation, or special symbol information • Handle dynamically generated code, self modifying code • Recording/Logging: ~100-200x • More recent logging • Proposed hardware support (for MT domain) • FDR (Flight Data Recorder) • BugNet (cache bits set on first load) • RTR (Regulated Transitive Reduction) • DeLorean (ISCA 2008- chunks of instructions) • Strata (time layer across all the logs for the running threads) • iDNA (Diagnostic infrastructure using NirvanA- Microsoft)
Deterministic Replay Re-execute the exact same sequence of instructions as recorded in a previous run • Single threaded programs • Record Load Values needed for reproducing behavior of a run (Load Log) • Registers updated by system calls and signal handlers (Reg Log) • Output of special instructions: RDTSC, CPUID (Reg Log) • System call (virtualization- cloning arguments, updates) • Checkpointing (log summary ~10Million) • Multi-threaded programs • Log interleaving among threads (shared memory updates ordering – SMO Log)
PinSEL – System Effect Log (SEL) Logging program load values needed for deterministic replay: • First access from a memory location • Values modified by the system (system effect) and read by program • Machine and time sensitive instructions (cpuid,rdtsc) Store A; (A 111) Program execution Store B; (B 55) Load C; (C = 9) Load D; (D = 10) Syscall modifies location (B -> 0) and (C -> 99) Load A; (A = 111) system call Load B; (B = 0) Logged Load C; (C = 99) Not Logged Load D; (D = 10) • Trace size is ~4-5 bytes per instruction
i = 1; for (j = 0; j < 10; j++) { i = i + j; } k = i; // value read is 46 System_call(); k = i; // value read is 0 (not predicted) Optimization: Trace select reads • Observation: Hardware caches eliminate most off-chip reads • Optimize logging: • Logger and replayer simulate identical cache memories • Simple cache (the memory copy structure) to decide which values to log. No tags or valid bits to check. If the values mismatch they are logged. • Average trace size is <1 bit per instruction • The only read not predicted and logged follows the system call
Example Overhead • PinSEL and PinPLAY • Initial work (2006) with single threaded programs: • SPEC2000 ref runs: 130x slowdown for pinSEL and ~80x for PinPLAY (w/o in-lining) • Working with a subset of SPLASH2 benchmarks: 230x slowdown for PinSEL • Now: Geo-mean SPEC2006 • Pin 1.4x • Logger 83.6x • Replayer 1.4x
Example: Microsoft iDNA Trace Writer Performance • Memchecker and valgrind are in 30-40x range on CPU 2006 • iDNA ~11x, (does not log shared-memory dependences explicitly) • Use a sequential number for every lock prefixed memory operation: offline data race analysis
Logging Shared Memory Ordering(Cristiano’s PinSEL/PLAY Overview) • Emulation of Directory Based Cache Coherence • Identifies RAW, WAR, WAW dependences • Indexed by hashing effective address • Each entry represents an address range Directory Dir Entry Dir Entry Store A Program execution Dir Entry hash Load B Dir Entry
Directory Entries • Every DirEntry maintains: • Thread id of the last_writer • A timestamp is the # of memory ref. the thread has executed • Vector of timestamps of last access for each thread to that entry • On Loads: update the timestamp for the thread in the entry • On Stores: update the timestamp and the last_writer fields Directory Thread T1 Thread T2 DirEntry: [A:D] T2 Last writer id: T1 1: Store A 1: Load F 1 T1: 2 T2: 2 Vector 2: Store A Program execution DirEntry: [E:H] 2: Load A 3: Load F Last writer id: T1 3: Store F 3 1 3 T1: T2:
Detecting Dependences • RAW dependency between threads T and T’ is established if: • T executes a load that maps to the directory entry A • T’ is the last_writer for the same entry • WAW dependency between T and T’ is established if: • T executes a store that maps to the directory entry A • T’ is the last_writer for the same entry • WAR dependency between T and T’ is established if: • T executes a store that maps to the directory entry A • T’ has accessed the same entry in the past and T is not the last_writer
Example Thread T1 Thread T2 DirEntry: [A:D] T2 Last writer id: T1 1: Store A 1: Load F WAW 1 T1: 2 T2: 2 2: Store A Program execution DirEntry: [E:H] RAW 2: Load A 3: Load F Last writer id: T1 WAR 3: Store F 3 1 3 T1: T2: Last_writer Last access to the DirEntry Last access to the DirEntry SMO logs: Thread T2 cannot execute memory reference 2 until T1 executes its memory reference 1 T2 2 T1 1 T1 2 T2 2 T1 3 T2 3 Thread T1 cannot execute memory reference 2 until T2 executes its memory reference 2
Ordering Memory Accesses (Reducing log size) • Preserving order will reproduce execution • a→b: “a happens-before b” • Ordering is transitive: a→b, b→c means a→c • Two instructions must be ordered if: • they both access the same memory, and • one of them is a write
To guarantee a→d: a→d b→d a→c b→c Suppose we need b→c b→c is necessary a→d is redundant Constraints: Enforcing Order P1 P2 a overconstrained b c d
Problem Formulation Dependence (black) Conflicts (red) Thread I Thread J Thread I Thread J ld A add ld A add st B st B st C st C st C Log st C ld B ld B ld D ld D st A st A sub sub st C st C ld B ld B st D st D Recording Replay • Reproduce exact same conflicts: no more, no less
Dependence Log 1 1 Log J: 23 14 35 46 16 bytes 2 2 3 3 Log I: 23 4 4 5 5 Log Size: 5*16=80 bytes (10 integers) 6 6 Log All Conflicts Thread I Thread J ld A add • Detect conflicts Write log st B st C st C ld B ld D st A sub st C ld B st D Replay • Assign IC • (logical Timestamps) • But too many conflicts
TR Reduced Log Log J: 23 35 46 Log I: 23 Log Size: 64 bytes (8 integers) Netzer’s Transitive Reduction Thread I Thread J TR reduced 1 ld A add 1 st B st C 2 2 st C ld B 3 3 ld D st A 4 4 sub st C 5 5 ld B st D 6 6 Replay
New Reduced Log Log J: 23 45 Log I: 23 stricter Reduced Log Size: 48 bytes (6 integers) RTR (Regulated Transitive Reduction): Stricter Dependences to Aid Vectorization Thread I Thread J 1 ld A add 1 st B st C 2 2 st C ld B 3 3 ld D st A 4 4 sub st C 5 5 ld B st D 6 6 Replay 4% Overhead RTR+FDR (simulated on GEMs) .2 MB/core/second logging (Apache)