Download
1 / 22
220 likes | 351 Views
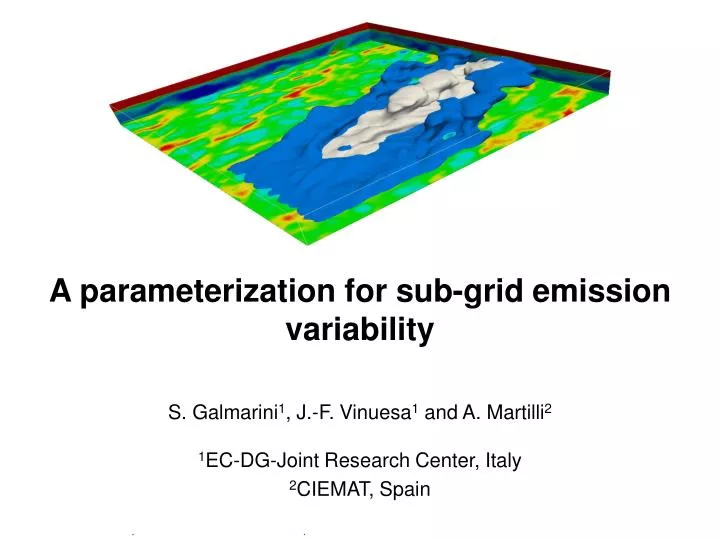
A parameterization for sub-grid emission variability. S. Galmarini 1 , J.-F. Vinuesa 1 and A. Martilli 2 1 EC-DG-Joint Research Center, Italy 2 CIEMAT, Spain. E. E. s E. How to transfer source intensity variability to upper atmospheric layers?.

E N D
A parameterization for sub-grid emission variability S. Galmarini1, J.-F. Vinuesa1 and A. Martilli2 1EC-DG-Joint Research Center, Italy 2CIEMAT, Spain
E sE
How to transfer source intensity variability to upper atmospheric layers? • Turbulent motions are responsible for creating and generating scalars concentration variance • In RANS scalar variance is accounted for by means of the variance conservation equations • The source variability at the surface can be though as a boundary condition of scalar variance equation that will take care of describing its transport in x, y and z, creation and dissipation
Approach • U=5m.s-1 • Total duration LES=3hours • The dynamic at the end of the first hour is used to fed FVM (u,v,w,theta). • Then emission is released for 2 two hours. Statistics are done over the last hour. 10 Km 10 Km LES =100 x 100 grid cells, 100 m resolution • Sv3=64% of 5x5km2 (LES-1) • Sv4=36% of 5x5km2(LES-2) • Sv5=25% of 5x5km2(LES-3) • Sv6=16% of 5x5km2(LES-4) • Release of=0.1 ppb.m.s-1 FVM= 2 x 2 grid cells, 5 km resolution
C D 64% surface emission B A C D B A Results:concentration variance 16% surface emission
Conclusion • A simple method to account for variability of emission • Possibility to add error bars to model results • Further steps: adding the information on the spatial variability
C D B A C D B A Results:mean concentration