Download
1 / 20
200 likes | 212 Views
Sheep and Beef data. Project Team Femi Olubode (WRC) Blair Keenan (WRC) Jon Palmer (WRC) Rex Webby (Rural Consultant) Ian Jamieson (Independent Consultant). The research process Illustrative results Some policy implications Concluding remarks. Outline. Data collection Case studies

E N D
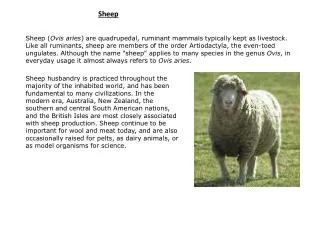
Sheep and Beef data Project Team Femi Olubode (WRC) Blair Keenan (WRC) Jon Palmer (WRC) Rex Webby (Rural Consultant) Ian Jamieson (Independent Consultant)
The research processIllustrative resultsSome policy implicationsConcluding remarks Outline
Data collection • Case studies • 450 Farms – surveyed to study pugging/flooding mgt • 170 Farms – allowed follow up questions • 20 farms – spatially selected • 13 farms – interviewed • 12 farms – full data • Focus Group discuss/Workshop
5 farm types/systems... 1. Small lamb finishing farm 2. Traditional Hill country farm 3. Hill country/dairy support (maize silage cropping) 4. Hill country/dairy support (pasture silage) 5. Bull & prime beef finishing farm
FARMAX modellingBiological feasibilityOVERSEER modellingNutrient budgets Scenario analysis…
Concluding remarks • Expected results in terms of nutrient loss mitigation • Higher level of N loss mitigation • Lower cost per nutrient loss mitigation • Some win-win solutions • Its more expensive to mitigate P than N • The forestry option however similar (highest P loss mitigation) • Reducing stocking rate is the least popular • Increasing sheep to cattle ratio, ‘win-win’ outcome is most popular • The highest marginal cost indicates the highest cost to any farm – although not most equitable but most efficient