Download
1 / 39
390 likes | 564 Views
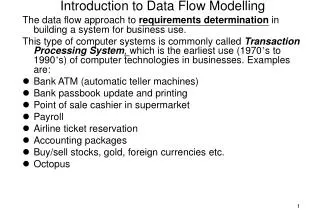
Data Flow Modelling II. Plan. Introduction Structured Methods Data Flow Modelling Data Modelling Relational Data Analysis Feasibility Maintenance. Ten Guidelines. Don’t expect to get it right first time – draw one to throw away* Draw a Document Flow Diagram to establish the context

E N D
Plan • Introduction • Structured Methods • Data Flow Modelling • Data Modelling • Relational Data Analysis • Feasibility • Maintenance
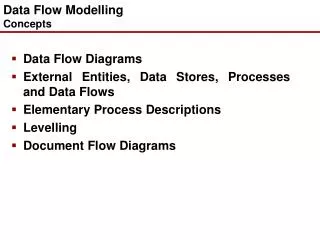
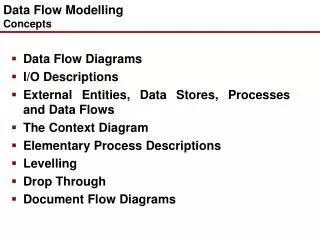
Ten Guidelines • Don’t expect to get it right first time – draw one to throw away* • Draw a Document Flow Diagram to establish the context • Check that you have identified all input and output document flows • Always draw a context diagram – it clarifies the context • Read through the system description noting candidate processes and data stores • Identify the External Entity that ‘starts’ the whole system process • Build the diagram one process at a time adding data stores as required • For each process identify the main output, all inputs and other outputs • For each process clearly mark any data flows that go to, or come from, nowhere • Once the processes are complete check through your work and tidy up loose ends • Check each process for consistency (what comes out must have gone in) • Check against the context for consistency (* But don’t throw it away)
Remember • Primary Output • What is the result of the process completing its job? Where does it go? • Inputs • What information does the process need in order to do its job? Where doe sit come from? • Other outputs • What information is required by other processes?
Remember • Check for consistency against Context • Check that what comes out went in • Check that all necessary detail has been included • I.E. show your diagram to a manager/end user of the existing system
aretailer Big John’s Store Sales Order Supply goods to retailer by ordering from wholesaler Sales Delivery Note Sales Invoice Payment bwholesaler Purchase Order Delivery Note Purchase Invoice Payment Example Context (Big John’s)
Group by Function • Lejk and Deeks suggest grouping processes by Function • This often makes the diagram less complex
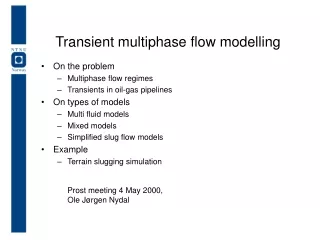
DFD Levelling • DFDs are a communication tool • They should be easy to follow for both skilled systems analyst and customer • Too much detail adds complication • but detail is necessary • Levelling is a way of achieving detail without adding complication • Different diagrams show different levels of abstraction
DFD Levelling (Lejk and Deeks, 2002)
Level 1 Diagram (Lejk and Deeks, 2002)
Level 2 Diagram for Process 1 (Lejk and Deeks, 2002)
Level 2 Diagram for Process 4 (Lejk and Deeks, 2002)
How many levels do we need? (Lejk and Deeks, 2002)
Guidelines • A large number of Data Flows into a process? • Certainly indicates lower level of details • Maybe should split the process • Large number of processes (more than 7)? • Should merge processes at current level • Implies lower level detail
How do we know when to stop? • Each Process will have a description • Size of Description? • DeMarco estimates that a 1-page “mini-spec” is sufficient detail • Also suggests basing decision on number of inputs and outputs • Inputs/outputs • Overall number
Elementary Process Descriptions • Used to describe the processes • One is required for every process • May be developed using: • Structured English • Decision Trees/Tables • Flow Charts
Structured English • Normal text is too ambiguous or too verbose • Has three logical constructs • Sequence • Selection • Iteration
Sequence • A list of actions performed in logical order • Example • Go to lecture room • Find seat at back • Read paper • Check watch • Listen to lecturer (5 mins max) • Check watch • Check watch • Yawn • Leave
Selection • Used where there is a selection of possible actions and that taken depends on the truth value of a condition • IF…THEN…ELSE • CASE
Selection Example • IF (have pen AND can be bothered) • THEN write notes • ELSE read newspaper • Make sure process has appropriate outputs for each alternative action
Iteration • When a set of actions is repeated a number of times, this number being determined by the truth value of a condition • REPEAT…UNTIL • WHILE • FOR each
Iteration Example REPEAT • Draw on Desk • Check watch • Yawn UNTIL Lecture Finished
Problems • There is a danger that we can get too formal • Remember that this is supposed to aid communication • There may be a need to write in structured English and then convert that into more regular English • There is a trade-off between formality and understandability • Try developing EPDs for Big John’s Store
Current Physical System • We now have a model of the current physical system which is: • Complete • Accurate • Clear • We now have to think about the system purely in terms of its process
Logicalisation – why? • Systems Evolve over time • Some processes become redundant, but are still present • Ad-hoc development causes processes to become tightly coupled • Some Process descriptions depend on hardware • These factors obscure our view of the system
Logicalisation – why? • Logicalisation helps to view the system without these factors • We can now see the wood not the trees
Logicalisation – how? (1) • Rationalise Data Flows • Replace documents with data • Examples • Delivery Note Delivery Details • Delivery Note (copy) Delivery Details
Logicalisation – how? (2) • Rationalise Data Stores • Remove duplication of data • Remove or rename stores that hold physical documents • Examples • Orders, Invoices and Delivery Notes • In trays are good candidates for removal
Logicalisation – how? (3) • Rationalise Processes • Remove people and places • Change experts into external entities • Remove processes that simply move data around within themselves
Logicalisation – how? (4) • Reconstruct DFD • Lower level processes will be radically different • These changes must be reflected at top level • New external entities may have been introduced • effect the context of the system
Level 1 Diagram - Physical (Lejk and Deeks, 2002)
References • Whiteley, D. (2004) Introduction to Information Systems, Palgrave, 2004. • Lejk, M. and D. Deeks (2002) Systems Analysis Techniques, Addison Wesley 2002 • Mason, D. and L. Willcocks (1994), Systems Analysis, Systems Design, Alfred Waller, 1994.
References • Yeates, D. and T. Wakefield (2004) Systems Analysis and Design, FT/Prentice Hall 2004 • Gane, C. and T. Sarson (1979) Structured Systems Analysis, Prentice Hall, 1979 • Eva, M (1994) SSADM Version 4: A users guide, McGraw hill, 1994
References • DeMarco, T. (1979) Structured Analysis and System Specification, Yourdon, 1979 • Royce, W. (1970) Managing the development of large software systems, In: Proceedings of IEEE WESCON, 1970 pp1-9.