Download
1 / 54
580 likes | 793 Views
Data Flow Modelling Concepts. Data Flow Diagrams I/O Descriptions External Entities, Data Stores, Processes and Data Flows The Context Diagram Elementary Process Descriptions Levelling Drop Through Document Flow Diagrams. Data Flow Modelling Modelling a system’s processes.

E N D
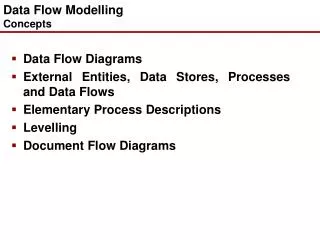
Data Flow ModellingConcepts • Data Flow Diagrams • I/O Descriptions • External Entities, Data Stores, Processes and Data Flows • The Context Diagram • Elementary Process Descriptions • Levelling • Drop Through • Document Flow Diagrams
Data Flow ModellingModelling a system’s processes • Data Flow Modelling is a widely used and mature analysis technique, and is recommended by most structured methods • DataFlowModels (DFMs) are easy to understand and, with a little practice, reasonably quick and straightforward to develop • They consist of two parts: a set of Data Flow Diagrams (DFDs) and a set of associated textual descriptions • … that provide us with the truly effective tool for understanding the information processes of a system
Data Flow Modelling • The Business Activity Model indicates the human activities that take place in the environment that concern us, but does not contain enough detail yet to build a computerised information system. • The technique of Data Flow Modelling is used to progress the analysis of the system’s processes by providing a more detailed model of all the system’s data processes.
Data Flow DiagramsA communication aid • Before we see how to produce a DFD we will show how a DFD can be used to communicate with users (who are not expected to understand how to produce one) • Imagine you work in a small stock control environment where goods are bought and sold • There are two job descriptions in our imaginary system: stock clerks and cashiers • Stock Clerks ‘order’ and ‘receive’ goods • Cashiers ‘sell’ goods • An analyst has observed you and come up with the following diagram…
Data Flow Diagrams aid communication e Manager Purchase Order 1 Stock Clerk Stock List Stock M2 Order Stock List P.O. File Stock d Supplier Purchase Order Delivery 2 Stock Clerk Purchase Order Receive Orders M1 Cabinet Stock * Matched Orders e Manager Delivered Goods 3 Cashier Stock Sell Sold Goods M2 File Stock * Bought Goods a Customer External Entities Processes Data Stores
Data Flow Diagrams • The Data Flow Diagram (DFD) is the visible part of the Data Flow Modelling (DFM) technique • If used, the DFD is drawn at the very beginning of the analysis where, in various guises, it helps define the context of the system under consideration • It then becomes, with the LDS, the main place for recording the analysts’ understanding of how the current system functions
Data Flow Diagrams • When a good understanding of the data movements of the current system has been achieved, the logic of the system is distilled from the DFD and a new ‘logical’ DFD may be produced • This DFD contains the essence of the system’s functionality, free from technical and physical constraints that may exist in the current system • With the logical view of the system in hand, the analysts propose alternative options for a new system • The users choose one of these options and a final DFD is drawn for the, by now, ‘required’ system
Data Flow DiagramsDFD Notation • The DFD is a diagram that consists principally of four symbols, namely the external entity, the dataflow, the process and the datastore • Additionally, a physical flow can be shown on the DFD of the current system
Data Flow DiagramsExternal Entities d Supplier
Data Flow DiagramsData Flows Customer Details Goods Cosmetics • Data Flow (usual) • Bi-directional Flow (rare) • Flow Between External Entities (for convenience) • Resource Flow (for convenience)
Data Flow DiagramsProcess Sell Stock 3 Cashier
Data Flow DiagramsData Stores D3 Suppliers Stock M1 File T1 Unpaid Invoices D1 Orders D1 Orders • Digitised • Manual • Transient • Duplicate
Data Flow Diagrams Decomposing Data Flow Diagrams • A closer look at process 1 of the Small Stock System also shows that it is logically consistent and does indeed describe the activity of ordering stock • On the other hand, it does not contain enough detail to understand exactly what happens when stock is ordered • For example:
Data Flow Diagrams Decomposing Data Flow Diagrams • Is there any time lapse between the production of a stock list and a firm order coming back? • When does a check of the product files take place? • Who is responsible for choosing which supplier to use? • The DFD deals with these issues by allowing more detailed views of the high level processes • This is done by breaking up each process into as many sub-processes as deemed necessary
Data Flow Diagrams Decomposing Data Flow Diagrams • Any process on a DFD may be broken up into several sub-processes which, when viewed collectively, make up that process • Thus for example we may break-up process 1 of the Small Stock System into that shown on the next slide:
e Manager 1 Order Stock Stock List Purchase Order 1.1 1.2 Produce Record Stock Purchase List Order Stock List Purchase Order Purchase Order Stock M2 M1 Cabinet File Data Flow Diagrams Decomposing Data Flow Diagrams * *
Data Flow Diagrams Decomposing Data Flow Diagrams • The decomposition of a DFD into lower level DFDs is known as levelling • The DFD that shows the entire system is known as the ‘top level’ or ‘level 1’ DFD • The DFDs that contain more detailed views of the level 1 processes make up ‘level 2’ DFDs • Any level 2 process that is further decomposed gives rise to a level 3 DFD and so on
Data Flow Diagrams Decomposing Data Flow Diagrams • A process that is decomposed is known as a ‘parent’ whose ‘children’ are the diagrams derived from it • Any process that does not contain any further decomposition ( i.e. has no children) is known as a ‘bottom level’ or ‘elementary’ process • These elementary processes constitute the building blocks of the system and as such need to be considered carefully
Data Flow Diagrams Decomposing Data Flow Diagrams • They will contain enough detail for a program specification to be deducible from them at a later stage • As such, a clear description of each one has to be produced at some time during the analysis • These Elementary Process Descriptions (EPDs) are written in plain English, or in pseudocode, depending on the project team. A sample EPD follows:
Data Flow Diagrams Decomposing Data Flow Diagrams Elementary Process Description System: SmallStock DFD Type: Current Process Name: Record Purchase Order Process Id: 1.2 Managers give the stock clerk a ready-made purchase order. The stock clerk places this order in the Purchase Order Cabinet. It is the managers’ responsibility to send the order directly to the supplier they have chosen. Each purchase order contains product information taken from the supplier’s price list. The date after which a delivery of goods will be unacceptable is also included.
1.2 Record Purchase Order Data Flow Diagrams Decomposing Data Flow Diagrams *
Data Flow Diagrams Decomposing Data Flow Diagrams • If there is a flow on a level 2 diagram that does not correspond to one on its parent diagram then something is wrong • In this case either the top level or the lower level diagram needs updating, depending on further analysis
Data Flow Diagrams Decomposing Data Flow Diagrams
e P.O. Manager Stock List Purchase Order Matched Orders d Small Stock Delivery Supplier System Bought Goods a Customer Data Flow Diagrams Context Diagrams • A level higher than level 1, showing the whole system as a single process with external entities around it, is also possible:
Data Flow Diagrams Context Diagrams • All the DFD rules apply here • All the incoming and outgoing flows to and from the context diagram should correspond directly with the flows seen flowing between all level 1 processes and the external entities they interact with • Further, since each lower level DFD is consistent with its parent diagram, it will be possible to trace each flow seen in the context diagram down to the elementary process that either generates that flow or receives it
Data Flow Diagrams I/O Descriptions • The flows shown on the Context Diagram are of vital importance since it is for these interactions with the outside world that the system exists and through which it will be judged as a good or a bad system • For this reason we ensure we are 100% confident with the content of each input to or output from the system by necessitating the completion of a document that traces each external flow down to an elementary process • This document is called an I/O Description:
Data Flow Diagrams Context Diagrams
Data Flow Diagrams Developing the processing view of the system • As with many systems analysis products there is no fixed way of producing a model (if indeed we decide to produce the said model in the first place!) • In the next few slides we will illustrate how some of our products can be used as precursors to Data Flow Modelling • Earlier in the series we met Business Activity Models and Resource Flow Diagrams • Today we are getting a feel for Data Flow Diagrams, including Context Diagrams • In what follows we will also introduce Document Flow Diagrams
Data Flow Diagrams Development – Drop Through • Either of these can be used as a starting point for modelling a system’s processing • We will use the ZigZag case study to show how we can move from one product to the other • If at any point of systems analysis you realise that you have produced something that is not used further in the analysis you should pause for thought… • …and question the prudence of developing the product in the first place • Each systems analysis product builds on the understanding contained in all its predecessors • The link between successive products is called drop through
Data Flow Diagrams Starting from the Context Diagram • To develop a Context Diagram we carry out the following tasks: (i) Identify all sources and recipients of data from the system, i.e. external entities (ii) Identify the major data flows to and from the external entities (iii)Convert each source or recipient into an external entity symbol (iv)Add the data flows between each external entity and a single box representing the entire system
Data Flow Diagrams Starting from the Context Diagram Supplier s Delivery Note r Purchase Order s Delivery Details s Invoice Purchaser s P.O. Quantities r Stock Report Customer r Dispatch Note Sales & Marketing s Customer Order r Matched C.O. #1 Accounts r Matched Invoices External Entity S or R Data Flow
Data Flow Diagrams Starting from the Context Diagram a Supplier Payment Delivery Note Purchase Order Delivery Invoice Details e d Matched Invoice Despatch Note Accounts Customer Stock Report Matched C.O. Customer Order Copy #1 P.O.Quantities Customer Order b c Sales and Purchaser Marketing ZigZag Warehouse System
Data Flow Diagrams Starting from the Context Diagram • We can now follow each flow into and identify the elementary process responsible for it • A grouping of these elementary processes can then give us a first glimpse of the system’s Data Flow Model
Document Flow Diagrams • Document Flow Diagrams illustrate the flow of physical documents associated with the area under investigation • In this context, documents may take the form of pieces of paper, conversations (usually over the telephone) or even data passed between computer systems • To create a Document Flow Diagram we carry out the following tasks:
Document Flow Diagrams • Identify all recipients and sources of documents, whether inside or outside the system boundary • Identify the documents that connect them • Convert each source and recipient into an external entity symbol • Add data flow arrows to represent each connecting document • Add the system boundary to exclude the external entities identified in the context diagram
Document Flow Diagrams Supplier Invoice P.O.Clerk Supplier Delivery Times Stock Clerk Stock Clerk Stock Report Purchaser Stock Clerk Stock Report Despatch Supervisor Despatch Clerk Despatch Note Customer Customer Customer Order Sales & Marketing Sales & Marketing Customer Order Despatch Clerk Despatch Clerk Despatch Report Despatch Supervisor Despatch Super. Matched Dsp Rep Despatch Clerk Despatch Clerk Matched CO #1 Sales & Marketing …. Source Document Recipient
Document Flow Diagrams Despatch Supervisor Sales and Matched Marketing Despatch Rpt Customer Order Despatch Report Matched C.O. Copy #1 Despatch Clerk
Data Flow DiagramsConverting Document Flow Diagrams What process generates this document flow? What process receives this document flow? Is the document stored by a process? Where is the document stored? Is the document created from stored data? What business activity triggers the process? Is the document a source of new data? To transform the Document Flow Diagram into a DFD we follow each document flow in turn, asking the following questions:
Data Flow DiagramsConverting Document Flow Diagrams In the case of our example we soon note that two data stores are used, the ‘stock’ file and the ‘customer orders’ file. We also quickly realise that ‘Sales and Marketing’ are clearly an external entity. It takes some time to realise that the Despatch Supervisor constitutes an external entity who decides where to pick the customer’s stock from. We are then left with the following two processes performed by the Despatch Clerk
Data Flow DiagramsConverting Document Flow Diagrams c 5 Despatch Clk f Sales and Customer Order Allocate Despatch Report Despatch Marketing Despatch Supervisor Current Stock 2 x C.O. Copies Levels Matched Despatch Rpt Customer M4 M2 Stock Orders Matched Despatch Rpt Stock To Be Used Customer Order Copy 6 c Despatch Clk Complete Matched C.O. Sales and Customer Copy #1 Marketing Order
Data Flow DiagramsConverting Resource Flow Diagrams In an environment where a number of different physical resources move around frequently, it may be a good idea to start by modelling the flow of resources instead of the flow of documents. With a resource flow in hand we can ask questions similar to those we asked when we were converting a Document Flow Diagram into a Data Flow Diagram, namely:
Data Flow DiagramsConverting Resource Flow Diagrams What process records the receipt of this resource? What process records the placement of the resource in a resource store? What process records the removal of the resource from a resource store? What new or old data accompanies the resource? What previously stored data is used in each movement of this resource?
Data Flow DiagramsConverting Resource Flow Diagrams 2 Goods Receiving b Check Supplier Delivery Delivery Note P.O. Copy Matched P.O. Purchase Orders M1 T2 Matched P.O.’s Matched P.O. New Stock M2 Stock 3 Stock Keeping Store Stock Loading Bay
Data Flow DiagramsConverting Business Activity Models • If a BAM has been produced as part of modelling a system’s processing, and if the Project Team has also decided to produce a DFD, then this DFD should be based on the analysis that led to the BAM. Indeed it would be folly to ignore the BAM and to try and produce the DFD ‘from scratch’ • A BAM is transformed into a DFD by asking of it questions such as: • Does the activity use data? • Is the activity responsible for the storage of new data? • Does the activity require already stored data?
Data Flow DiagramsConverting Business Activity Models Check Delivery 2 Goods Receiving b Check Supplier Delivery Place Goods Delivery Note in Delivery Dock P.O. Copy Matched P.O. Purchase Orders M1 Allocate Stock T2 Matched P.O.’s Location Matched P.O. Remove Goods from Delivery Dock New Stock M2 Stock 3 Stock Keeping Store Stock Store Goods in Depot
Relationship Between Processing Models • Lectures 2 and 4 have been dedicated to modelling the current processes (as opposed to data) of a system • Four processing models have been recommended: • Resource Flow Diagrams • Document Flow Diagrams • Business Activity Models and • Data Flow Models. • We have demonstrated how to use any of these diagrams as a starting point and we have also shown how to use some of these diagrams to assist the production of others • As with most of systems analysis there are no fixed rules as to what to do first or second or even at all.
Relationship Between Processing Models Business Activity Model Data Flow Model Document Flow Diagram Resource Flow Diagram
Data Flow DiagramsTips • The drawing of DFDs is an iterative activity • However clear a completed DFD looks, it should be appreciated that to draw one many passes have to be made (with a lot of paper ending up in the waste-paper basket!). • A DFD starts taking its final shape when it is possible to produce a clear list of data items (or attributes) for each and every one of its data flows.
Purchase Orders M1 P.O. Copy M2 Stock Data Flow DiagramsTips • Direct flows of information between two data stores are evidently not possible