Download
1 / 9
90 likes | 96 Views
General Pattern of the Hydrologic Balance in the Sava River Basin. Dragoslav Isailovi ć , Ph.D.C.E.* Prof. Stevan Prohaska, Ph.D.C.E* Brankica Majki ć , B.S. Hydrogeology* *Institute for Water resources development „Jaroslav Č erni“, 11226 Pinosava – Belgrade, Serbia

E N D
General Pattern of the Hydrologic Balance in the Sava River Basin Dragoslav Isailović, Ph.D.C.E.* Prof. Stevan Prohaska, Ph.D.C.E* Brankica Majkić, B.S. Hydrogeology* *Institute for Water resources development „Jaroslav Černi“, 11226 Pinosava – Belgrade, Serbia E-mail: brankica.majkic@jcerni.co.rs
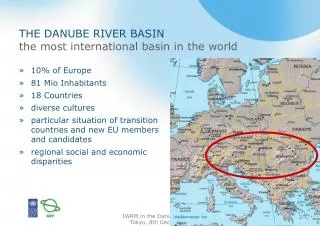
Main characteristics of the Sava River Basin (1/2) Sava river length: 944,7 km* Basin area: 97.713,2 km2** Mean discharge: 1564 m3/s*** *586 km navigable before 90-ies **2nd Danube tributary (after Tisza) *** 1st Danube tributary (almost 25% of total discharge)
The Sava River basin encompasses 95.000 km2. It drains flat areas in the north (left part of the drainage) and rugged mountains at the south and western parts. • Mean annual precipitation within the catchment ranges between 700 and 2,800 mm/year, with the average over the whole drainage about ??? mm/year. • Components of hydrologic balance are assessed at different ways: • Precipitation, P, is measured at a relatively large number of locations (approximately ???? gauging stations • Runoff, Q, is measured at a satisfactory number of gauges, from which relatively reliable estimates of the average runoff, R, can be made for relatively big sub-catchments; • Measurements of actual evapo-transpiration, Ea, practically do not exist. • In this paper, we discuss a general pattern of rainfall-runoff relationship that can be useful in assessing annual runoff from small (usually ungauged) catchments as well as to check the results of hydrologic calculations for bigger rivers
The presented model assumes a simple linear relationship between total precipitation, P, and runoff, R expressed as water depth over the considered drainage. The plot of this relationship relies upon 110 data points • Figure below shows the nature and parameters of this relationship. (2) • Visual impression indicates a high reliability of the relation, while coefficient of correlation confirms it. Fig.1
The above Equation facilitates derivation of relationship between total rainfall, P, and actual evapo-transpiration, Ea. as depicted in Figure 2. Actual annual evapo-transpiration slightly rises with an increase of total precipitation, as defined by the following equation (4) • Over the catchment, except at a few locations, it virtually ranged from 500 mm/year to 700 mm/year. • Opposite trend of change (i.e. decrease of evapo-transpiration with a rise of total precipitation) could be possible at some catchments where rainfall gets larger do to increase of altitude, while at the same time available energy for evaporation gets less. Fig.2
Eq. 2 transforms to yield a hyperbolic relation the coefficient of correlation, η, to average annual precipitation, P, as follows: (%) (5) • Figure 3 depicts this relationship. It appears that runoff coefficient, η, at the considered locations ranges between 30 and 75 %. However, some micro-locations within the Sava River Basin can have even much lover runoff. The highest values are met in the rugged mountainous regions of Monte Negro, Bosnia and Slovenia. Fig.3
The first derivative of the expression (5) is: (%/mm) (6) • The above result should not be judged on the merit of the quantification it yields. Instead, it should be viewed as an indication of general behavior of runoff. Namely, it suggests that change of runoff is reciprocal to the square of average annual precipitation. In another words, runoff will be significantly affected in regions with small precipitations, while in areas characterized by high precipitation its influence will be considerably less. • This result can be useful in considerations of impact of the expected climatic changes upon the change of water resources.
CONCLUSIONS • There are relatively good relationships between basic components of water balance. This fact facilitates rough assessment of runoff at un-gauged catchments • The parameters from this model should not be regarded an accurate quantification of the relation between components of hydrologic balance. However, the results presented in this paper can help gaining a broad picture of behavior of the considered processes. • Analyses and elaborations in the planned hydrologic study of the Sava River Basin should carefully take into account and comprehensively re-examine the previously mentioned aspects regarding irregularity of actual evapo-transpiration in some sub-catchments; • Particularly valuable aspect of this paper is formulation of relationship of runoff’s change with regard to the change of precipitation (Eq. 6); • Results stemming from the described lumped model cannot be substitution for collected hydrologic data. Instead, they should be used as a tool for harmonization of results calculated from the field observation and measurements.