Download
1 / 45
450 likes | 562 Views
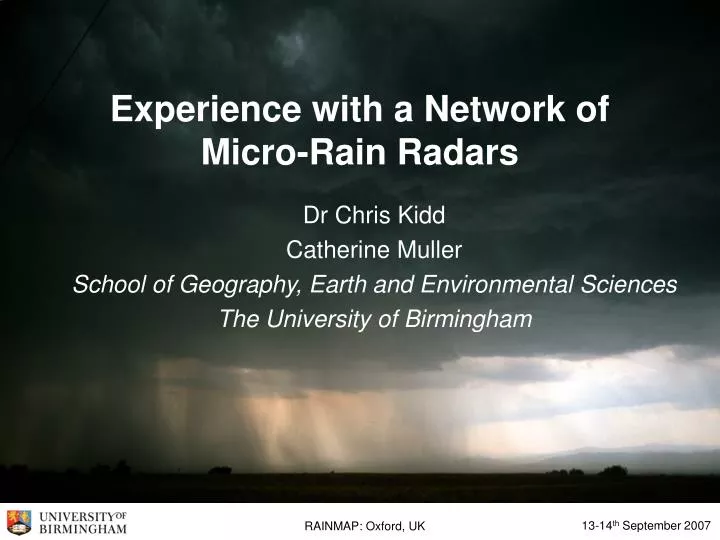
13-14 th September 2007. RAINMAP: Oxford, UK. Experience with a Network of Micro-Rain Radars. Dr Chris Kidd Catherine Muller School of Geography, Earth and Environmental Sciences The University of Birmingham. Rain… why we're here. 13-14 th September 2007. RAINMAP: Oxford, UK.

E N D
13-14th September 2007 RAINMAP: Oxford, UK Experience with a Network of Micro-Rain Radars Dr Chris Kidd Catherine Muller School of Geography, Earth and Environmental Sciences The University of Birmingham
13-14th September 2007 RAINMAP: Oxford, UK A few basic calculations 1 mm of rainfall over 1 m2 = 1000000 mm3 1000000 mm3 = 1000 cm3 = 1 litre = 1 kg of water 1 mm or rainfall over 1km2 = 1000000 kg or 1000 t 100 mm of rainfall – as in the July 20th event will produce 100,000 tonnes of water every 1 km2 over the Severn-Trent region, 2.16 billion tonnes of water!
13-14th September 2007 RAINMAP: Oxford, UK Conventional measurements The physical measurement of rainfall is still the 'truth' • Standard gauge: still used and the 'standard' • Tipping bucket gauges (TBRs): fixed quantitative tip, limited by accuracy of tip (e.g. amount) and timing resolution (e.g. actual tips, 15 mins etc). • Tilting siphon: Graphical – difficult to automate & losses when siphoning. All reasonable at measuring time-integrated rainfall, but not necessarily rain intensity. • Scanning radars okay, but suffer from range of calibration issues: DSD's, range effects, clutter etc. But – how reliable are they?
13-14th September 2007 RAINMAP: Oxford, UK TBR data – 1 minute resolution
13-14th September 2007 RAINMAP: Oxford, UK Comparison of 8 TBRs + 4 MRR
13-14th September 2007 RAINMAP: Oxford, UK
13-14th September 2007 RAINMAP: Oxford, UK
13-14th September 2007 RAINMAP: Oxford, UK
13-14th September 2007 RAINMAP: Oxford, UK
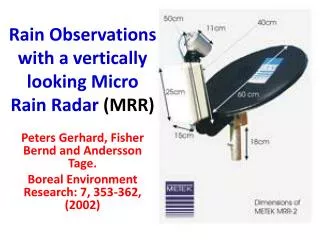
13-14th September 2007 RAINMAP: Oxford, UK MRR characteristics high sensitivity to light rainfall 10-200 m typically, with 31 range gates: 310-6200 m usually integrated over 1 min up to ~12 ms-1 Doppler – measures frequency of backscatter
13-14th September 2007 RAINMAP: Oxford, UK The Micro Rain Radar
Small backscatter Transmit signal Receive signal 13-14th September 2007 RAINMAP: Oxford, UK Background: Rain droplet Frequency
13-14th September 2007 RAINMAP: Oxford, UK Rain droplets Larger backscatter Transmit signal Receive signal Frequency
13-14th September 2007 RAINMAP: Oxford, UK Falling rain droplets Larger backscatter Transmit signal Receive signal Frequency
13-14th September 2007 RAINMAP: Oxford, UK Mixed-sized falling rain droplets Larger backscatter Transmit signal Receive signal Frequency small drops = slower = less shift large drops = faster = more shift
13-14th September 2007 RAINMAP: Oxford, UK Mixed-sized falling rain droplets Larger backscatter Transmit signal Receive signal Frequency in reality a "continuous" spectrum of return signals
13-14th September 2007 RAINMAP: Oxford, UK What information do you get? • Reflectivity • Rain intensity • Fall velocity • Liquid water content • Drop size distribution (in 64 steps) …for each of the 31 range gates
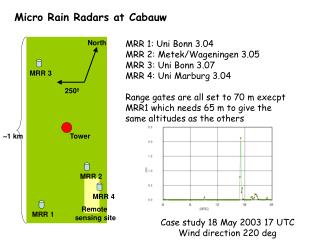
13-14th September 2007 RAINMAP: Oxford, UK Birmingham facility Calibration phase: • 4 micro rain radars • 8 calibration gauges (2/radar) • 1 active rain sampler • 2 passive rain samplers
13-14th September 2007 RAINMAP: Oxford, UK 5th October 2006: Warm front
13-14th September 2007 RAINMAP: Oxford, UK MRR time-series 07-10 February 2007
13-14th September 2007 RAINMAP: Oxford, UK Comparison of reflectivities Good rain/no-rain agreement; reasonable reflectivity
13-14th September 2007 RAINMAP: Oxford, UK Comparison of rainrates Good rain/no-rain agreement; reasonable intensities
13-14th September 2007 RAINMAP: Oxford, UK Comparison of rainrates Good rain/no-rain agreement; reasonable intensities
13-14th September 2007 RAINMAP: Oxford, UK Scatterplots: reflectivities & rainrates Reflectivity 5th October 2006 Rainrates Low-end reflectivity scatter: high-end rain-rate scatter
13-14th September 2007 RAINMAP: Oxford, UK Rainfall occurrence (Bham) Light rainfall is dominant – although rain-rates -> 150mmh-1 < 1 mmh-1 1 minute rain rates derived from Doppler radar (10 months data)
13-14th September 2007 RAINMAP: Oxford, UK Rainfall occurrence 1 minute rain rates derived from 4 Doppler radars (4x10 months data)
13-14th September 2007 RAINMAP: Oxford, UK Rainfall accumulation 1 minute rain rates derived from 4 Doppler radars (4x10 months data)
13-14th September 2007 RAINMAP: Oxford, UK MRR derived storm height 12957 > 3km 30613 rain events mmh-1 30% of events have storm heights < 1km; 50% <1.8km; 70% < 3km
13-14th September 2007 RAINMAP: Oxford, UK Current deployment 4 MRRs deployed in and around Birmingham: • Urban site: University of Birmingham: Edgbaston • Downwind site: Tamworth • Upwind (SW) site: Droitwich Spa • Upwind (W) site: Wombourne Purpose: to measure changes in precipitation characteristics over an urban area: does DSD distribution vary – anthropogenic aerosols? Chemical composition of rainwater
13-14th September 2007 RAINMAP: Oxford, UK Birmingham MRRs Tamworth Wombourne University 10 km Droitwich prevailing wind
13-14th September 2007 RAINMAP: Oxford, UK Typical MRR setup Droitwich: Back garden (!) – connected to mini-ITX based PC (1.2GHz, 1Gb RAM, 40Gb HD, WinXP)
13-14th September 2007 RAINMAP: Oxford, UK Analysis of June 2007 storms
13-14th September 2007 RAINMAP: Oxford, UK Regional rainfall totals Radar suggest bulk of rain west of M5, over Herefordshire
13-14th September 2007 RAINMAP: Oxford, UK EA TBR gauge measurements
13-14th September 2007 RAINMAP: Oxford, UK Reflectivity: 20th July 2007 Tamworth x Birmingham x x Droitwich 2km Clee Hill
13-14th September 2007 RAINMAP: Oxford, UK Fall velocity: 20th July 2007 Tamworth x Birmingham x x Droitwich 2km Clee Hill
13-14th September 2007 RAINMAP: Oxford, UK 1 minute MRR vs Gauge Demonstrates the problems associated with tip measurements (can be worked around) Scale: mm/min
13-14th September 2007 RAINMAP: Oxford, UK 5 minute MRR vs Gauge Again, demonstrates the problems associated with tip measurements (can be worked around) Scale: mm/5-min
13-14th September 2007 RAINMAP: Oxford, UK 15 minute MRR vs Gauge Reasonable agreement overall Scale: mm/15-min For July: Gauge – 179mm MRR level 1 – 161mm MRR level 2 – 149mm
13-14th September 2007 RAINMAP: Oxford, UK Rainfall accumulation Gauge-corrected MRR Differences between accumulations over time to be investigated
13-14th September 2007 RAINMAP: Oxford, UK Overall conclusions • MRR's provide an additional means of observing and measurement rainfall • Useful for extraction of other parameters, e.g. DSD • Measurements over a number of levels – providing profiles of hydrometeors • Can measure frozen precipitation (i.e. hail, snow) where gauges might have difficulty However • Generally, they tend to underestimate rainfall with respect to gauge • They do not replace conventional gauges.
13-14th September 2007 RAINMAP: Oxford, UK Future ideas • GPM – 2013+ Global constellation of passive microwave sensors GV element: organisation and co-ordination of sensors and observations (radar, gauges, observations, aircraft etc) Improved observation, monitoring and measurement of global precipitation Greater understanding of precipitation processes: occurrence, accumulation etc; measurement accuracy; anthropogenic influences; climate change