Download
1 / 30
310 likes | 317 Views
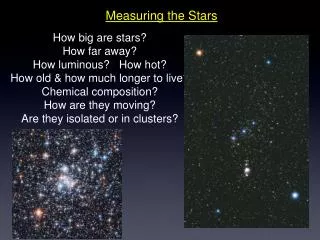
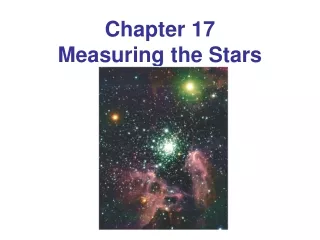
Chapter 10 Measuring the Stars. Units of Chapter 10. The Solar Neighborhood Luminosity and Apparent Brightness Stellar Temperatures Stellar Sizes The Hertzsprung-Russell Diagram Extending the Cosmic Distance Scale Stellar Masses. 10.1 The Solar Neighborhood.

E N D
Units of Chapter 10 The Solar Neighborhood Luminosity and Apparent Brightness Stellar Temperatures Stellar Sizes The Hertzsprung-Russell Diagram Extending the Cosmic Distance Scale Stellar Masses
10.1 The Solar Neighborhood Parallax: look at apparent motion of object against distant background from two vantage points; knowing baseline allows calculation of distance ***3600 arcseconds in a degree 1 parsec = 3.3 light-years
10.1 The Solar Neighborhood Neareststar to the Sun: Proxima Centauri, which is a member of a 3-star system:Alpha Centauricomplex (3 stars orbiting each other) Model ofdistances: Sunis a marble,Earthis a grain of sand orbiting 1 m away Nearest staris another marble 270 km away Solar system extends about 50 m from Sun; rest of distance to nearest star is basicallyempty
10.1 The Solar Neighborhood The30 closest starsto the Sun:
10.1 The Solar Neighborhood Barnard’s Star (top) has the largest proper motion of any – proper motion is the actual shift of the star in the sky, after correcting for parallax. The pictures (a) were taken 22 years apart. (b) shows the actual motion of the Alpha Centauri complex.
10.2 Luminosity and Apparent Brightness Luminosity, or absolute brightness, is a measure of the totalpowerradiated by a star. (We don’t see its luminosity) Apparent brightnessis how bright a star appears when viewed from Earth; it depends on theabsolute brightnessbut also on thedistanceof the star: = proportional to
10.2 Luminosity and Apparent Brightness This is an example of an inverse square law
10.2 Luminosity and Apparent Brightness Therefore, two stars that appear equally bright might be acloser, dimmerstarand afarther, brighterone:
10.2 Luminosity and Apparent Brightness Apparent luminosityis measured using amagnitude scale, which is related to our perception. It is alogarithmicscale; a change of 5 in magnitude corresponds to a change of a factor of 100 in apparent brightness. It is alsoinverted– larger magnitudes are dimmer.
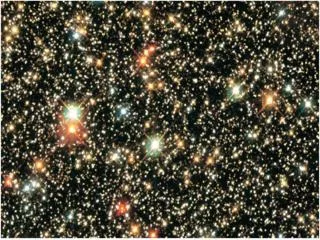
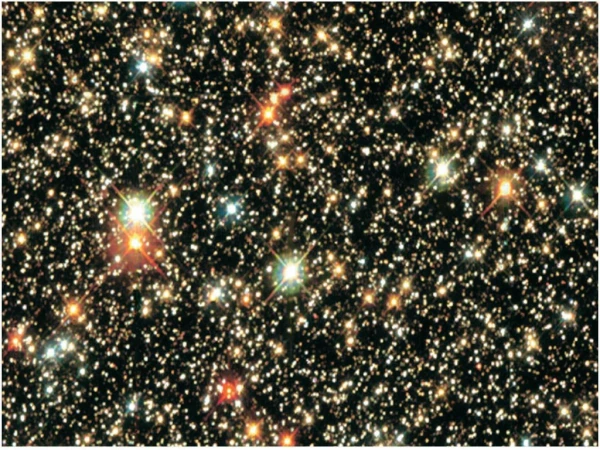
10.3 Stellar Temperatures Thecolorof a star is indicative of itstemperature.Redstars are relatively cool, whileblueones are hotter. What constellation is this? Looking at the Milky Way up close Orion
10.3 Stellar Temperatures The radiationfrom stars isblackbodyradiation; as the blackbody curve is not symmetric, observations at two wavelengths are enough to define the temperature:
10.3 Stellar Temperatures Stellar spectraare much more informative than the blackbody curves. There aresevengeneral categories of stellar spectra, corresponding to differenttemperatures. From highest to lowest, those categories are: (highest temp)O B A F G K M(lowest temp) “Oh Boy A Fine Girl/Guy Kissed Me” is a way to remember the order
10.3 Stellar Temperatures The seven spectral types:
10.3 Stellar Temperatures The different spectral classes have distinctive absorption lines.
10.4 Stellar Sizes A few very large, very close stars can be imaged directly usingspeckle interferometry; this isBetelgeuse:
10.4 Stellar Sizes For the vast majority of stars that cannot be imaged directly, size must be calculated knowing theluminosityandtemperature: Giant starshave radii between 10 and 100 times the Sun’s. Dwarf starshave radii equal to, or less than, the Sun’s. Supergiant starshave radii more than 100 times the Sun’s.
10.4 Stellar Sizes Stellar radiivary widely:
10.5 The Hertzsprung-Russell Diagram The H-R diagramplotsstellar luminosityagainstsurface temperature. This is an H-R diagram of a fewprominent stars:
10.5 The Hertzsprung-Russell Diagram Once many stars are plotted on an H-R diagram, apatternbegins to form: These are the80 closest starsto us; note the dashed lines ofconstant radius. The darkened curve is called theMain Sequence, as this is where most stars are. Also indicated is thewhite dwarfregion; these stars are hot but not very luminous, as they are quite small.
10.5 The Hertzsprung-Russell Diagram An H-R diagram of the100 brightest starslooks quite different: These stars are allmore luminousthan the Sun. Two new categories appear here – thered giantsand theblue giants. Clearly, thebrighteststars in the sky appear bright because of their enormousluminosities, not their proximity.
10.5 The Hertzsprung-Russell Diagram This is an H-R plot of about 20,000 stars. Themain sequenceis clear, as is thered giantregion. About90%of stars lie on the main sequence;9%are red giants and1%are white dwarfs.
10.6 Extending the Cosmic Distance Scale • Spectroscopic parallax: has nothing to do with parallax, but does use spectroscopy in finding the distance to a star. • Measure the star’sapparent magnitudeand spectral class • Usespectral classto estimateluminosity • Applyinverse-square lawto finddistance.
10.6 Extending the Cosmic Distance Scale Spectroscopic parallaxcan extend the cosmic distance scale to several thousand parsecs:
10.6 Extending the Cosmic Distance Scale The spectroscopic parallax calculation can be misleading if the star is not on themain sequence. Thewidthof spectral lines can be used to defineluminosity classes:
10.7 Stellar Masses -Most stars are inbinary pairs -determine mass by measuring orbital motion -visual binaries observed directly -spectroscopic binaries measured by doppler effect -eclipsing binaries can be measured using intensity variations
10.7 Stellar Masses Massis the main determinant of where a star will be on theMain Sequence: Mסּ=Solar Mass
10.7 Stellar Masses Stellar mass distributions – there are many more small stars than large ones!
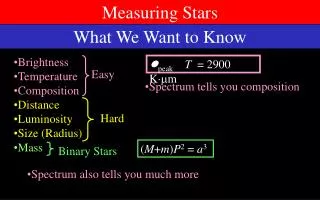
Summary of Chapter 10 • Distance to nearest stars can be measured by parallax • Apparent brightness is as observed from Earth; depends on distance and absolute luminosity • Spectral classes correspond to different surface temperatures • Stellar size is related to luminosity and temperature
Summary of Chapter 10 • H-R diagram is plot of luminosity vs. temperature; most stars lie on main sequence • Distance ladder can be extended using spectroscopic parallax • Masses of stars in binary systems can be measured • Mass determines where star lies on main sequence