Download
1 / 24
240 likes | 356 Views
Measuring Stars. Easy. Hard. Binary Stars. What We Want to Know. Brightness Temperature Composition Distance Luminosity Size (Radius) Mass. l peak T = 2900 K m. Spectrum tells you composition. ( M + m ) P 2 = a 3. Spectrum also tells you much more. Luminosity and Brightness.

E N D
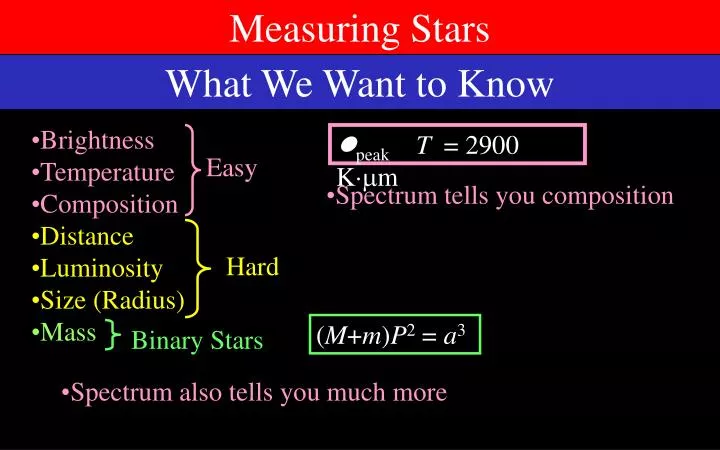
Measuring Stars Easy Hard Binary Stars What We Want to Know • Brightness • Temperature • Composition • Distance • Luminosity • Size (Radius) • Mass lpeakT = 2900 Km • Spectrum tells you composition (M+m)P2 = a3 • Spectrum also tells you much more
Luminosity and Brightness • The LuminosityL is how much power something is putting out • The BrightnessB is how brightsomething appears • They are related: Sphere: A = 4d2 d L = 4d2B Star A and star B are equally bright, but star A is farther away. Which one is actually more luminous? A) Star A B) Star B C) They are equally luminous D) There is insufficient information • The brightness is always easy to determine • If we can get one of the distance or the luminosity, we can get the other.
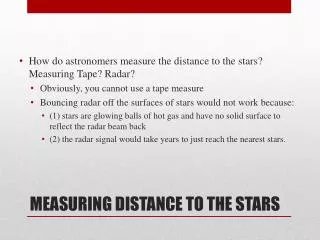
Finding the Distance Easy Hard • Brightness • Temperature • Composition • Distance • Luminosity • Size (Radius) • Mass • If we can get the distance, we can get the luminosity too • We will use a new unit for measuring distance, the light year • The distance light goes in a year ly = 9.46 1015 m = 63,240 AU • Real astronomers use parsecs • But we won’t
Methods for Finding Distance • Radar • Solar System Only • Excellent accuracy • Parallax • Nearby Stars (< 300 ly) • Moderate accuracy • Spectroscopic Parallax • Main Sequence Stars only • Poor accuracy
Radar Distance Earth Venus d 2d = ct, solve for d • We know what an AU is • Effectively no error
Methods for Finding Distance • Radar • Solar System Only • Excellent accuracy • Parallax • Nearby Stars (< 300 ly) • Moderate accuracy • Spectroscopic Parallax • Main Sequence Stars only • Poor accuracy
Parallax • The distance to an object can be judged if you view it from two angles • The difference in the angle you see it from is called parallax • The more distant, the smaller the parallax
Parallax p p • The farther apart you put your “two eyes”, the better you can judge distance • The smaller p is, the farther away the star is. d • p in arc-seconds (The distance 3.26 ly is also known as a parallax second) parsec nearest stars several ly away Centauri C = Proxima Centauri : 4.2 ly Sirius: 9 ly
Spectral Type • The following are all equivalent information: • The surface temperature of a star • The color of the star • The spectral type of the star • From hottest to coldest, OBAFGKM • Subdivided 0-9, with 0 the hottest • Sun is a G2 star • The spectral type is easy to determine Why I hate astronomers “Oh Be A Fine Girl, Kiss Me.” • Which star is hottest? • G2 B) G4 • C) F3 D) F7
Spectra and Motion – Doppler Effect Star A Spectrum Hydrogen Spectrum Star A is A) Made of a hydrogen variant B) Moving towards us C) Moving away from us D) Rotating
Announcements DateRead Today Sec. 11.1, 11.2 Wednesday Sec. 12.1, 12.2 Thursday Sec. 12.3 • Posted Now: • Test 2 questions • Test 2 solutions • Midterm grades • Lab Tonight • Out-4, Out-6, In-4 6/14
Spectra and Motion – Doppler Effect Star B Spectrum Hydrogen Spectrum • Binary stars are two stars that are orbiting each other • A spectroscopic binary are two stars that look like one but their binary nature can be deduced from their spectrum Star B is A) Made of two kinds of hydrogen B) Moving away from us AND moving towards us C) Actually two stars moving at different speeds
Spectra and Motion – Doppler Effect Star C Spectrum – Day 0 Star C Spectrum – Day 50 Star C Spectrum – Day 100 Star C Spectrum – Day 150 Star C Spectrum – Day 200 • Other object could be smaller in mass • This is the Doppler method whereby we discover planets around other stars Hydrogen Spectrum Star C is A) In orbit around an invisible companion B) Alternately expanding and contracting C) Alternately heating and cooling D) Rotating
Summary – What Spectra Tell Us • Temperature • From the peak of the spectrum • Composition • From wavelengths and strength of dark lines • Motion • From the Doppler shift • Multiplicity • From the number of sets of spectral lines • Orbit and masses • From the changing Doppler shift • Pressure and rotation • From width of lines
Luminosity, Temperature, and Radius • The spectrum of a star is pretty much a black body distribution • How bright each point on the surface is depends only on temperature • Multiply by the area to get the Luminosity F =T4 L = AF = 4R2T4 • Star X is the same temp. as the Sun, but it is 4 times more luminous. How large is it? • 2 times the Sun • 4 times the Sun • 16 times the Sun • 44 = 256 times the Sun
Intrinsic Properties of Stars • To describe stars, we want to talk about intrinsic properties • Luminosity • Composition • Temperature • Composition is almost always the same • Mass is difficult to measure • Radius can be deduced from Luminosity and Temperature • Radius • Mass Temperature andLuminosity
The Hertzsprung-Russell Diagram • A plot of temperature vs. luminosity • Hot on left, cold on right • Luminous at top, dim at bottom • Stars fall into categories: • The Main Sequence contains about 90% of the bright stars • The Giants are rare but very bright • The Supergiants are very rare but extremely bright • The White Dwarfs are not uncommon but very dim
Main Sequence Stars • Main Sequence stars have different sizes, masses, and luminosities • But spectral class determines everything else • This diagram shows correct relative sizesand approximate colors of stars • But not correct relative luminosities
Luminosity from Spectral Class • Suppose you have a G2 star. What is its luminosity? • 90% of all stars are main sequence G2: B5: K5: • For main sequence stars, the spectral type tells you the luminosity • Together with brightness, this tells you the distance • Spectroscopic parallax
Spectroscopic Parallax • Another distance method • Has nothing to do with parallax • Works only on main sequence stars • How it works: • Observe the star – determine it’s brightness B • Measure its spectral type from spectrum • Deduce its luminosity from the Hertzsprung-Russell Diagram • Find its distance from: L = 4d2B
Stellar Masses • Only some stars can have their masses measured • They need to be in binary systems • The masses of main sequence stars depends pretty much only on their spectral type T M T M T M O5 60 F0 1.6 K5 .74 B0 18 F5 1.3 M0 .51 B5 5.9 G0 1.05 M5 .21 A0 2.9 G5 .92 M8 .06 A5 2.0 K0 .85
The Main Sequence • The mass of a main sequence star affects everything • Temperature • More massive is hotter • Luminosity • More massive is much more luminous • Radius • More massive is bigger