Download
1 / 182
1.82k likes | 1.83k Views
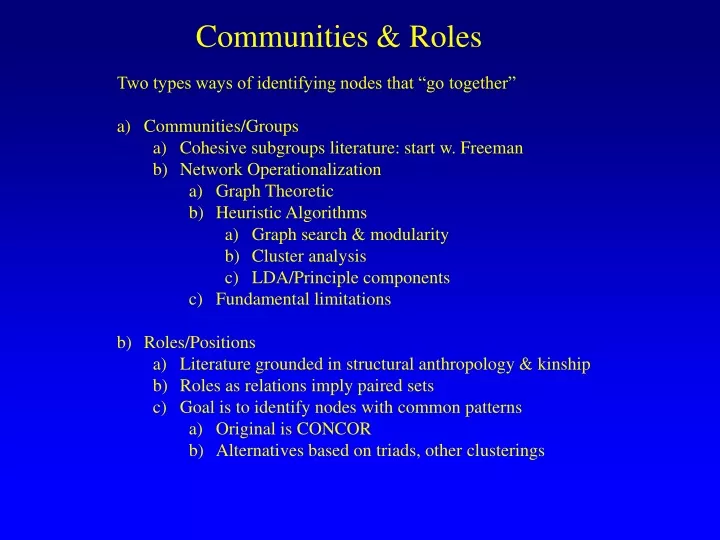
Communities & Roles. Two types ways of identifying nodes that “go together” Communities/Groups Cohesive subgroups literature: start w. Freeman Network Operationalization Graph Theoretic Heuristic Algorithms Graph search & modularity Cluster analysis LDA/Principle components

E N D
Communities & Roles • Two types ways of identifying nodes that “go together” • Communities/Groups • Cohesive subgroups literature: start w. Freeman • Network Operationalization • Graph Theoretic • Heuristic Algorithms • Graph search & modularity • Cluster analysis • LDA/Principle components • Fundamental limitations • Roles/Positions • Literature grounded in structural anthropology & kinship • Roles as relations imply paired sets • Goal is to identify nodes with common patterns • Original is CONCOR • Alternatives based on triads, other clusterings
Social Sub-groups Lin Freeman: The sociological concept of “Group” Focus on collectivities that are: “Relatively small, informal, and involve close personal ties.” What we would call “Primary Groups” What (network) structure characterizes such a group? Goal: Identify (a) non-overlapping groups that allow one to (b) identify internal group structure.
Social Sub-groups Lin Freeman: The sociological concept of “Group” Winship’s Model: 1) Assign people to equivalence classes that are hierarchically nested:
Social Sub-groups Lin Freeman: The sociological concept of “Group” Winship’s Model: In words, this means that whatever metric you define, a person is closer to themselves than to anyone else, that the relation be symmetric, and that triads be transitive (which, given the symmetric condition, means that they be complete). You can then identify partitions by scaling the proximity, such that these three conditions are met.
A B C D E F G H I J K A .5544443333 B 5 . 544443333 C 55 . 44443333 D 444 . 5553333 E 4445 . 553333 F 44455 . 53333 G 444555 . 3333 H 3333333 . 555 I 33333335 . 55 J 333333355 . 5 K 3333333555 . Social Sub-groups Lin Freeman: The sociological concept of “Group” Winship’s Model:
Social Sub-groups Lin Freeman: The sociological concept of “Group” Winship’s Model: total {A-G} {H-K} {A-C} {D-G}
Social Sub-groups Lin Freeman: The sociological concept of “Group” Granovetter’s Model: Proceed exactly as in Winship, but treat intransitivity differently when looking at strong or weak ties. If x and y are strongly connected, and y and z are strongly connected, then x and z should be at least weakly connected.
Social Sub-groups Lin Freeman: The sociological concept of “Group” Granovetter’s Model: An example of a graph fitting the prohibition against G-intransitive relations.
Social Sub-groups The Davis - “Old South” Example
Social Sub-groups The Davis - “Old South” Example: Ties > 2
Social Sub-groups The Davis - “Old South” Example: Ties > 3
Social Sub-groups The Davis - “Old South” Example: Ties > 4 Meets the G-transitivity condition
Social Sub-groups The Davis - “Old South” Example: Ties > 5 Stronger than the G-transitivity condition
Social Sub-groups Lin Freeman: The sociological concept of “Group” Freeman argues that the G-intransitivity model fits the data best for each of the 7 groups he studies. Substantively, the types of groups this model predicts are very similar to those predicted by the general transitivity model, except re-cast as a valued relation. Empirically, if you want to identify groups based on levels like this, you can use PAJEK and walk through the model in just the same way as we did with “Old South” or you can use UCI-NET (or program it, it’s not hard)
Methods: How do we identify primary groups in a network? A) Classic graph theoretical methods: Cliques and extensions of cliques • Cliques • k-cores • k-plexes • Freeman (1992) Models • K-components (we talked about these already) B) Algorithmic methods: search through a network trying to maximize for a particular pattern (I.e. like Frank & Yasumoto) • Adjust assignment of actors to groups until a particular pattern of ties (block diagonal, usually) is identified. • Standard models: - Factions (UCI-NET) - KliqueFinder (Frank) • RNM/CROWDS/JIGGLE (Moody) • Principle component analysis (PCA) • Flow models (MCL) • Modularity Maximization routines - General Distance & Clustering Methods
Methods: How do we identify primary groups in a network? Graph Theoretical Models. Start with a clique. A clique is defined as a maximal subgraph in which every member of the graph is connected to every other member of the graph. Cliques are collections of nodes where density = 1.0. Properties of cliques: • Density: 1.0 • Everyone connected to n-1 alters • Distance between every pair is 1 • Ratio of within group ties to between group ties is infinite • All triads are transitive
Methods: How do we identify primary groups in a network? Graph Theoretical Models. In practice, complete cliques are not very useful. They tend to overlap heavily and are limited in their size. Graph theorists have thus relaxed the complete connectivity requirement (with varying degrees of success). See the Moody & White paper on cohesion for a discussion of many of these attempts.
Methods: How do we identify primary groups in a network? Graph Theoretical Models. k-cores: Every person connected to at least k other people. Ideally, they would look something like this (here two 3-cores). However, adding a single tie from A to B would make the whole graph a 3-core
Methods: How do we identify primary groups in a network? Graph Theoretical Models. Extensions of this idea include: K-plex: Every member connected to at least n-k other people in the graph (recall in a clique everyone is connected to n-1, so this relaxes that condition. n-clique: Every person is connected by a path of N or less (recall a clique is with distance = 1). N-clan: same as an n-clique, but all paths must be inside the group. I’ve never had much luck with any of these methods empirically. Real data is usually too messy to work well. You should try them, and gain some intuition for yourself. The place to start is in UCINET.
Methods: How do we identify primary groups in a network? Graph Theoretical Models. UCINET will compute all of the best-known graph theoretic treatments for subgroups
Methods: How do we identify primary groups in a network? Graph Theoretical Models. Consider running different methods on a known group structure:
Methods: How do we identify primary groups in a network? Graph Theoretical Models.
Methods: How do we identify primary groups in a network? Graph Theoretical Models. Cliques
Methods: How do we identify primary groups in a network? Cliques The only way to get something meaningful from this is to analyze the clique overlap matrix, which is what the “Clique by partion” dataset does, using cluster analysis
Methods: How do we identify primary groups in a network? Heuristic strategies for identifying primary groups: Search: 1) Fit Measure: Identify a measure of groupness (usually a function of the number of ties that fall within group compared to the number of ties that fall between group). 2) Algorithm to maximize fit. Once we have the index, we need a clever method for searching through the network to maximize the fit. Destroy: Break apart the network in strategic ways, removing the weakest parts first, what’s left are your primary groups. See “edge betweeness” “MCL” Evade: Don’t look directly, instead find a simpler problem that correlates: Examples: Generalized cluster analysis, Factor Analysis, RM.
Methods: How do we identify primary groups in a network? Search: Optimize a partition to fit Segregation Index (Freeman, L. C. 1972. "Segregation in Social Networks." Sociological Methods and Research 6411-30.) Freeman asked how we could identify segregation in a social network. Theoretically, he argues, if a given attribute (group label) does not matter for social relations, then relations should be distributed randomly with respect to the attribute. Thus, the difference between the number of cross-group ties expected by chance and the number observed measures segregation.
Methods: How do we identify primary groups in a network? Search: Optimize a partition to fit Consider the (hypothetical) network below. There are two attributes in this network: people with Blue eyes and Brown eyes and people who are square or not (they must be hip).
Blue Brown Blue 6 17 Brown 17 16 Hip Square Hip 20 3 Square 3 30 Methods: How do we identify primary groups in a network? Search: Optimize a partition to fit Segregation Index Mixing Matrix: Seg = -0.25 Seg = 0.78
Methods: How do we identify primary groups in a network? Search: Optimize a partition to fit Segregation Index One problem with the segregation index is that it is not ‘margin free.’ That is, if you were to change the distribution of the category of interest (say race) by a constant but not the core association between race and friendship choice, you can get a different segregation level. One antidote to this problem is to use odds ratios. In this case, and odds ratio tells us the relative likelihood that two people in the same category will choose each other as friends.
Complete Network Analysis Network Connections: Social Subgroups Segregation index compared to the odds ratio: Friendship Segregation Index r=.95 Log(Same-Sex Odds Ratio)
Methods: How do we identify primary groups in a network? Search: Optimize a partition to fit The second problem is that the Segregation index has no clear maximum – if every node is assigned to a single group the value can be higher than if everyone is assigned to the “right” group. -- it tends to have a monotonically changing score. This means you can’t just keep adjusting nodes until you see a best fit, but instead have to look for changes in fit. The modularity score solves this problem by re-organizing the expectation in a way that forces the value to 0 if everyone is in a single group.
Methods: How do we identify primary groups in a network? Search: Optimize a partition to fit We can also measure the extent that ties fall within clusters with the modularity score: Where: m is the number of edges k is the degree Aij is the edge weight between ij d(cicj) is 1 if in the same group g is the resolution parameter Q has the advantage of going to 0 if there is only 1 group, which means maximizing the score is sensible. Note resolution parameter means N of groups is not truly “automatic”
Methods: How do we identify primary groups in a network? Search: Optimize a partition to fit Modularity Scores Comparison to Segregation Index – comparing values for known solutions Modularity Score Plotted against Segregation Index for various nets
Methods: How do we identify primary groups in a network? Search: Optimize a partition to fit Number of groups In-group Density
Methods: How do we identify primary groups in a network? Search: Optimize a partition to fit • Louvain Method (Blondel et al) in PAJEK & R • Factions in UCI-NET • Multiple options for the exact factor maximized. I recommend either the density or the correlation function, and I would calculate the distance in each case. • Frank’s KliqueFinder • Moody’s crowds / Jiggle • Generalized blockmodel in PAJEK • iGraph (R) has a couple that see this sort (Fast-Greedy is good)
Methods: How do we identify primary groups in a network? Search: Optimize a partition to fit Factions in UCI-NET
Factions in UCI-NET Reduced BlockMatrix 1 2 3 4 5 6 -- -- -- -- -- -- 1 59 1 2 14 1 0 2 1 54 0 1 12 2 3 1 2 55 0 1 12 4 9 1 1 51 0 0 5 0 12 2 0 62 1 6 1 0 9 2 0 64 Fit perfectly
Methods: How do we identify primary groups in a network? Search: Optimize a partition to fit UCINET Biggest drawbacks of FACTIONS are: • SLOW • Have to specify the number of groups.
R – “Fast Greedy” This is a direct optimization of Modularity
PAJEK – “Louvain” This is a direct optimization of Modularity
Methods: How do we identify primary groups in a network? Evade: Find a “cheap” indicator, and cluster/optimize that Cluster analysis In addition to tools like FACTIONS, we can use the distance information contained in a network to cluster observations that are ‘close’ to each other. In general, cluster analysis is a set of techniques that allows you to identify collections of objects that are simmilar to each other in some degree. A very good reference is the SAS/STAT manual section called, “Introduction to clustering procedures.” (http://wks.uts.ohio-state.edu/sasdoc/8/sashtml/stat/chap8/index.htm) (See also Wasserman and Faust, though the coverage is spotty). We are going to start with the general problem of hierarchical clustering applied to any set of analytic objects based on similarity, and then transfer that to clustering nodes in a network.
Cluster analysis Imagine a set of objects (say people) arrayed in a two dimensional space. You want to identify groups of people based on their position in that space. How do you do it? How Smart you are How Cool you are
Methods: How do we identify primary groups in a network? Evade: Find a “cheap” indicator, and cluster/optimize that Start by choosing a pair of people who are very close to each other (such as 15 & 16) and now treat that pair as one point, with a value equal to the mean position of the two nodes. x
Methods: How do we identify primary groups in a network? Evade: Find a “cheap” indicator, and cluster/optimize that Now repeat that process for as long as possible.
Methods: How do we identify primary groups in a network? Evade: Find a “cheap” indicator, and cluster/optimize that This process is captured in the cluster tree (called a dendrogram)
Methods: How do we identify primary groups in a network? Evade: Find a “cheap” indicator, and cluster/optimize that As with the network cluster algorithms, there are many options for clustering. The three that I use most are: • Ward’s Minimum Variance -- the one I use almost 95% of the time • Average Distance -- the one used in the example above • Median Distance -- very similar Again, the SAS manual is the best single place I’ve found for information on each of these techniques. Some things to keep in mind: Units matter. The example above draws together pairs horizontally because the range there is smaller. Get around this by standardizing your data. This is an inductive technique. You can find clusters in a purely random distribution of points. Consider the following example.
Methods: How do we identify primary groups in a network? Evade: Find a “cheap” indicator, and cluster/optimize that Cluster analysis The data in this scatter plot are produced using this code: data random; do i=1 to 20; x=rannor(0); y=rannor(0); output; end; run;
Methods: How do we identify primary groups in a network? Evade: Find a “cheap” indicator, and cluster/optimize that Cluster analysis Resulting dendrogram