Download
1 / 15
150 likes | 180 Views
Explore the vast land and marine area of responsibility, monitoring hurricanes, ecosystems, and more. Utilize advanced data analysis tools and observe zillions of data points daily from various sources for reliable forecasting.

E N D
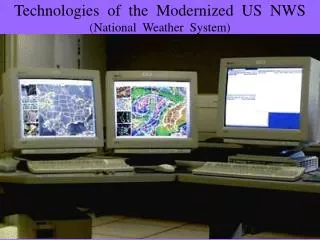
Robert Grumbine Robert.Grumbine@noaa.gov Diane Stokes, Jeff Whiting, John Derber, Steve Levine, Dennis Keyser, Joe Sienkiewicz, Kelley Kempisty, … Environmental Modeling Center NCEP/NWS/NOAA US NWS Data Monitoring
NWS • Land area of responsibility > 10 million km^2 • Marine area of responsibility > 25 million km^2 • Hurricanes to Ivu • Fukushima, Ecosystems, ... • Minutes to Months
Users • GFS, CFS, NAM, RTOFS, WAVEWATCH III(tm), … • SST … analyses (QDOI, Weekly, RTG-HR) • 9 National Forecast Centers • 122 Weather Forecast Offices • 13 River Forecast Centers • Zillions of people, companies
Observations currently used • Radiosondes • Pibal winds • Wind profilers • Conventional aircraft reports • Aircraft reports (temperatures/winds) • Dropsondes • Visible, IR and water vapor winds • Surface land observations • Surface ship and buoy observations • Synthetic tropical cyclone winds • Doppler radial velocities • VAD (NEXRAD) winds • GPS precipitable water estimates • GPS Radio occultation bending angle profiles • SBUV ozone profiles and OMI total ozone • Satellite measured radiances (brightness temperatures) John Derber
Data • Through Office of Operations • Including VOS, co-op, cocorahs, weather bug • NESDIS • >2*10^9 observations/day • In to NCEP via NCO • To assimilation systems (EMC) • To analysis systems (EMC) • To forecast centers (CPC, OPC, SPC, ...)
Observational (mostly mesonet) Data Issues Anybody can set up a mesonet site with little training, knowledge, warning CWOP, Weatherbug obs dominate the station counts Lack of consistent siting, equipment standards Also many DOT, University sponsored mesonets (generally more reliable) Many different mesonet providers, but we mostly treat them all the same Should we? All mesonets weighted the same, less than METAR via GTS/TOC (obs weighted by type) Sites MADIS collects overlap with other data sources METAR/AWOS sites, NOS sites, some buoys Duplicate checking tough to do between ob types What’s a bad/unrepresentative ob? On what scale? How do we find them? Who do we call when we find a bad ob? You see obs we don’t (or don’t want to see) We see obs you don’t For non-mesonets, station dictionaries must be updated (requires RFC) Steve Levine
Quantity Monitoring (Global) • Http://www.nco.ncep.noaa.gov/ • pmb/nwprod/gdas • Category Subcategory T00Z T06Z T12Z T18Z Total Number Total Input % Input • Land Sfc Synoptic 19544 19804 20394 19916 79658 79658 * • * METAR 48157 50006 51794 50162 200119 200119 * • * sub-total 67701 69810 72188 70078 279777 279777 ****
Real Time Mesoscale Analysis (RTMA) Gridded (NDFD resolution) hourly near real time surface fields for situational awareness, verification, ‘analysis of record’ Used for tuning National Blend, initial forecast grid population Use all available surface obs and near-surface satellite wind obs over water Mesonet (MADIS Integrated mesonet feed) METAR Surface Synoptic Surface Ship Buoy ASCAT winds Satellite winds over water and below 850 hPa Assimilate obs with background field (short-term forecast, RAP/NAM/HRRR) Un-Restricted mesoscale analysis (URMA) runs 6 hours later to pick up latent data (also includes min/maxT) Overlap, duplicate, and quality issues with and across all types!! Steve Levine
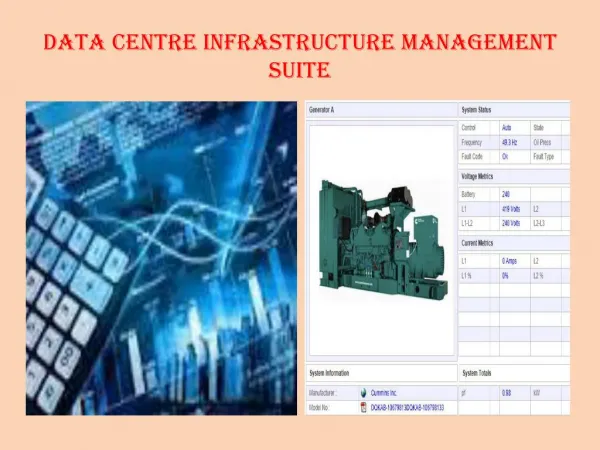
Data Processing for RTMA BUFR Tanks /dcom Different tanks/dumps for different types - not cross checked GTS NCO/PMB EMC/MMB tranjb dumpjb Gather data decode NWSTG/ TOC/ “Gateway” Station dictionaries Dump Files LDM Satellite ingest scripts “Katz” scripts/EMC TNC Conventional data tranjb Non-conventional Data MADIS LDM PREPDATA Prevents SYNDATA CQCBUFR PROFCQC CQCVAD PREPACQC ACARSQC PREPBUFR Analysis (GSI QC happens here) Parm cards SMS job queries NESDIS servers for new data Radar ROC BUFR mnemonic table Global (not RTMA) Guess (perhaps relocated) NESDIS tcvitals FTP *original slide from Dennis Keyser (EMC) Via Steve Levina (EMC) Outside NCEP Inside NCEP
Quality Control in RTMA/URMA Now MADIS MADIS marks of reject (X) are flagged but monitored Prepbufr SDMedit reject list for non-mesonet data (dynamic, updated instantly by/through SDM but requires manual intervention) GSI ‘Gross error’ O-B check (relaxed by terrain, buddy check for temp) Provider/subprovider accept lists and Station-based reject/accept lists for mesonets (static, required RFC to change) (StationID based) Dynamic reject list (O-B last 6 hours) “Variational” QC (problems with 2+ obs/hour/station) Data could also ‘fall on floor’ during decoding or ingest Wrong type, dictionary not updated, etc. Steve Levine
Quality Monitoring of Satellite Data AIRS Channel 453 26 March 2007 Increase in SD Fits to Guess John Derber
Quality Monitoring of Satellite Data NOAA-19 HIRS July 2nd 2013 – Filter Wheel Motor Problems Initial Problem When we stopped assimilating Initial “fix” to instrument John Derber
Fabric, not flow Computer (model, analysis, assimilation, …) People Data