Download
1 / 21
230 likes | 370 Views
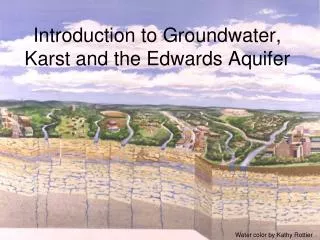
Vulnerability map of the Edwards Aquifer. Rami Harfouch November 2009, Austin. Lake Travis. The Edwards Aquifer. Gauging station at Blanco River at Wimberley. Alamo Village. Hugo Boss Outlet in San Marcos. Crown and Anchor. Kyle Seale Parkway in northwest Bexar county in 2008.

E N D
Vulnerability map of the Edwards Aquifer Rami Harfouch November 2009, Austin
Lake Travis The Edwards Aquifer Gauging station at Blanco River at Wimberley Alamo Village Hugo Boss Outlet in San Marcos Crown and Anchor
D R A S T I C Depth of Water Conductivity of the Aquifer Soil Topography Aquifer Media Vadose Zone Recharge of the Aquifer V = D . λD + R . λR + A . λA + S . λS + T . λT + I . λI + C . λc DRAST I C λ : 5 4 3 2 1 5 3
Depth of Water USGS Wells Data
Depth of Water (m) High : 70 Low : 12 Drastic rating 1 2 3 5
Drastic Rating 1 3 9 Recharge of the Aquifer • TWDB data • 3 Recharge zones: Outcrop (2 in/yr), downdip (< 2in/yr), holes (>10 in/yr)
Drastic rating 8 Aquifer Type • Assuming that the Edwards is exclusively a limestone aquifer
Soil Type STATSGO SSURGO Set of spatial and tabular data linked through a dynamic database
TRAVIS COUNTY Bedrock SOIL TYPE Clay Clay loam Fine sand Fine sandy loam Loam Loamy fine sand Loamy sand Sandy clay Sandy loam Silty clay Silty clay loam Silty loam Very fine sandy loam Soil Type (Aller et al.)
DRASTIC rating 1 3 4 5 6 7 9 Soil Type
Topography/Slope • NED Flow direction (% drop) Slope map
DRASTIC rating 1 3 5 9 10 Topography/Slope
DRASTIC rating 1 3 4 6 8 Vadose Zone Vadose Zone = Geologic Map
Drastic Rating 10 Conductivity of the Aquifer Since we assumed that Limestone is the only aquifer media K >> 25 m/day
Recharge Depth of Water Soil Aquifer Media Conductivity Vadose Zone Vulnerability map of the Edwards Aquifer Topography
DRASTIC INDEX 84 - 90 90 - 978 97 - 104 104 – 111 111 - 118 118 - 125 125 - 132 132 - 139 139 - 146 Vulnerability map of the Edwards Aquifer Aquifer (least vulnerable aquifers) 65 < DRASTIC INDEX < 225 ( most vulnerable)
Land Use/ Land Cover Barren Land Cultivated Crops Deciduous Forest Developed, High Intensity Developed, Low Intensity Developed, Medium Intensity Developed, Open Space Emergent Herbaceuous Wetlands Evergreen Forest Hay/Pasture Herbaceuous Mixed Forest Open Water Shrub/Scrub Woody Wetlands DRASTIC rating 1 2 3 4 5 8 10 Land use (Gomezdelcampo, 2007)
Risk Index 92 - 100 100- 108 108 - 116 1168 - 124 124 - 133 133 - 141 141 - 149 149 - 157 157 - 166 Vulnerability map + Land use = Aquifer pollution risk map
75-80% of the Edwards recharge water comes from the rivers in the outcrop region!! • Availability of the DRASTIC raw data online…for the USA • Possibility to build models and automate the procedures